Showing posts with label Canterbury. Show all posts

Monday, 14 November 2016

Quake Swarm in New Zealand at November Supermoon

Significant seismic unrest has returned to New Zealand on November 14 2016, coinciding with the closest lunar transit of Earth in 2016 -the November 14 Supermoon [Full Moon in Scorpio-Taurus]
the energy of the building full moon - this was when the first quakes emerged at 2 minutes after midnight
  • This lunar event at 22 degrees [exact sun-moon opposition in NZ on Nov 15] was under the strain of transiting Uranus at 21 Aries.
  • Uranus is exact in its interaction with the sun on Nov 14. This planetary force is commonly associated with out of the blue events - earthquakes, accidents, sudden eruptions of energy - which can emerge in the form of natural forces in the environment or associated with forces expressed through biological species such as humans, animals.
[update Nov 21: apart from the multitude of cracks in the NZ landscape and structures due to the extended quake swarm, significant accident energy far from the quake zone has occurred in NZ in addition to significant quake energy. Tree crashing onto cars, child killed on play equipment, major impact accidents in Dubai and the derailment of a train near Kanpur India with large numbers of fatalities and injuries, on Nov 20 ]

  •  Scorpio-Taurus energies involve not only the physical human body and the Earth's physical forms but also their transformation ....
  • The potential for negative outcomes or at least major change is increased greatly when a planet capable of triggering the solar-lunar axis is mathematically in range of the positions of the sun and moon.
  • The Moon - the commonest timing trigger has dominant influence at the top, aligned with the meridian axis
  • multiple factors at 1-3-5-7 degrees synergise
  • Neptune is exact on the lunar nodal axis at 9 degrees and 9 degrees [Virgo] was the preceding solar eclipse point in September. Water  = sea - was effected but Neptune's location away from the main chart axes is likely to have lessened the scope for a tsunami event
  • highly destructive and large scale plutonic forces enter the picture with the combination of Pluto and Jupiter meeting at 14 degrees -a position which also triggers the full Cancer-Capricorn-Aries-Libra group of planets [Uranus-Jupiter-Pluto] plus the horizontal axis ranging from 7-21 degrees = 14 midpoint.
  • Being in close proximity to a strong solar-lunar event and with Neptune so closely aligned with the lunar nodal axis, WATER must be considered as an ongoing threat potential in the ensuing days after the seismic swarm began to unfold [already water sources on land from dams to swimming pools have collapsed] but the known threat still relates to a landslide event along the steep coastal environment around Kaikoura generating a tsunami
  • [update Nov 17 2016 - WATER threats have included flooding and torrential rain in various parts of NZ in recent days including the zones of seismic unrest but in respect of quake related issues, landslip debris has created river dams that are collecting water and at risk of sudden breaches]
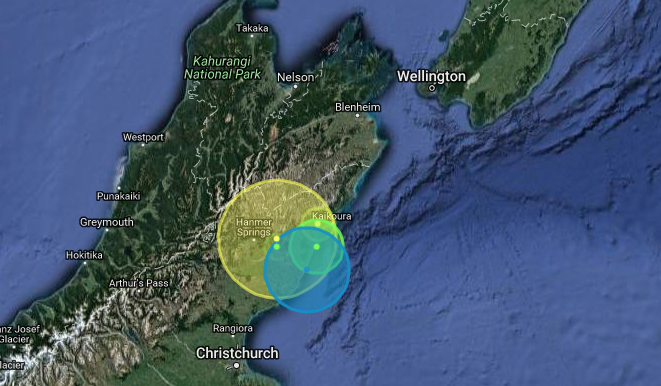
and a small sample -some of Nov 15 quakes in the triangle from Hamner Springs to Kaikoura - mainly on land, a few on the seabed. The animation shows an effect like being scatter-bombed from beneath. [a perfect representation of the prevailing Pluto-Uranus-Jupiter synergy]


Occurring in North Canterbury just past midnight as the date November 14 ticked over, 2 earthquakes appear to have occurred so close in time in separate locations, tricking the computers into recording an amalgamated M7.5 trigger event, with over 50 aftershocks within the subsequent 11 hours.
The epicentre is sitting astride the major crustal plates of the Pacific-Australia region and is therefore at ongoing risk for some time


Canterbury became high risk after major seismic events of 2010-2012 in particular - with the people and city of Christchurch severely impacted. Now the energy has moved North as anticipated...
also read TSUNAMI DREAMS
updated post first published Oct 1 2011

This is what a M8.2 looked like January 1855 Wairarapa lower North Island, New Zealand
  • The horizontal axis at 12 degrees is dominated by Neptune [water indicator]
  • The Moon [timing trigger] at 12 degrees linked to Uranus [earthquake indicator] and Venus [another timing factor - in support of the Moon]
  • Multiple factors hovering in a tight range provides a chain reaction of forces
  • In addition the chain reaction is amplified by a locomotive effect of Sun-Mercury-Jupiter synergising energies
  • Uranus was stationary direct -allowing full potency to its eruptive effects
  • critical degrees between 12-14 responded to the trigger eclipse of November 1854 
  • read more detail re signatures evident for this event which was NZ's biggest magnitude quake tsunami 


read extensive background material regarding the perceived long-term vulnerabilites
Some exacts from the blog post on Christchurch quakes since 2010:


Sunday, 20 January 2013

Canterbury & Christchurch Earthquakes 2013

Seismic activity in Canterbury and Christchurch New Zealand has acquired a renewed uptick, commencing January 2013.
[For prior documentation of quake events impacting the region, since the initial event of September 4 2010, please refer to posts such as Christchurch Shakes Again and Again. and the end of 2012 summary.]

This post operates like a timeline - scroll to end for latest updates
January 2013 data shows date time, magnitude, depth and location of a strong event.
Jan 19 2013 @ 9.15 pm M4.62, 11.8 kms deep, 380m from 265 Selwyn Rd Rolleston

This magnitude does not fall in the Top 100 range for the region (min Mag 4.74)
but there has not been one of similar size since April 12 2012 M4.60 in the east at New Brighton. Between April 12 2012 and prior to this 2013 event of M4.42, only 4 aftershocks have exceeded M4.6, all in the middle months of 2012, and the last being:

July 6 2012 M4.88  12.62kms deep, 130m from 246 Brookside Rd Rolleston Canterbury

What these two events have in common is their location in the region of  the eastern surface rupturing of the initiating Greendale Fault of September 2010.

On Jan 19 2013 further aftershocks were at 9.48pm (M2.38) - in the region of the first
On Jan 20 2013 two aftershocks ( M3.59, M3.05 occurred in the morning - 7.09, 7.17 am. Both of these were in the region of the western end of the Greendale fault.

A gradual quietening of activity in recent months has lulled locals into less expectation of jolts but local seismologist Mark Chadwick expects aftershocks in the range of M3.
Relatively shallow rumblings have reawakened.

   Updates are added to this 2013 log, as entries below, where necessary

References:
Data from Canterbury Quakelive

January 28 2013
Quakelive provides an intriguing data graphic re the time of day since Sept 4 2010 of quakes in Chch-Canterbury M3+. 
In overall frequency, 2pm is the top ranked time of day for the earth to move in the overall region of Canterbury in this current swag of seismic sequences.
2pm also has a sizeable chunk of the M4+ events - but not the most M5+ - that honour goes to 4am - and its neighbour 5am gets special mention for its top spot in the M4+ category


                                            CLICK to enlarge
As for the Top 5 since Sept 4 2010:

The time frames  around 4am, and 1-3pm also figure significantly

Visit their site for daily updates

January 30 2013
In a surprising development, (due to location) two aftershocks (?)  have occurred this afternoon, south of Akaroa on the seafloor - around latitude 43.53S - M3.79 and M3.11 in close succession

In the Top 100 events (M4.74 is current holder of the 100th position), the aftershock on Oct 8 2011 at 4.17 pm, M4.81, depth 7.18kms is the furtherest south event -  being in Richfield Road, Port Levy, which is 43.40S latitude

February 5 2013
This screenshot shows the latest 25 quakes across the region, largely forming a latitudinal band, with a spread from west to east & into seafloor zones
                                         click to enlarge                       source: Quakemap
The energy graphs on both Quakemap and Quakelive can be read as showing renewed vigour in this phase, occurring since late January 2013

Feb 10 2013
Clustering around New Moon, an area south east of Rolleston is showing a string of quakes up to M3.8, adding vigour to the energy output of this long sequence
                                                                source: Quakemap


Feb 13 2013
The noted focus around Rolleston continues in this snapshot from Quakemap showing the region of most of the prior 25 quakes. 6 of that 25 are in the range M3.3-M3.9 and 3 of this group are in the zone of most activity across the region, circled in image below;


February 22 2013
The two-year anniversary is commemorated in respect of the 2nd and most destructive event in the sequences since Sept 4 2010 - The Press reports
Almost as if in response, the largest shake since Feb 10 occurs in Pegasus Bay - 5 tonnes of energy at 9kms deep, at 2.54 am - yes the current sequence still contains considerable energy, being in a sustained up phase for the past month according to the energy graphs such as Quakemap
Quakelive graphic
Death of a Cathedral - a drone camera filmed inside the Christchurch Cathedral this week, upsetting and frustrating the Bishop Victoria Matthews, who says legal wrangles over the fate of the building are leading it to "die without dignity" with ongoing aftershocks and environmental effects. -
report and video
Interesting that the Christian perspective is so different from the Buddhist when it comes to change, transformation and death.  The acceptance of these three fundamentals of life is so central to Buddhist philosophy yet so problematic in a Christian framework.

A late night M3.9 quake in Pegasus Bay is the largest in the region since 19 January 2013 - this being 9 tonnes, 7.7kms deep around 11pm. Further confirmation of renewed energy in this sequence.

This Quakelive graphic shows that from mid July 2012-mid January 2013 there were repeated lulls in regional activity. since then, continual higher energy events up to M4.6 (Jan 19 2013)

For some perspective:
The initial rural Darfield, Canterbury quake of M7.1 on Sept 4 2010 released 671 kilotonnes of energy 
The next highest quake M6.3 -damaging central Christchurch released 49 kilotonnes
It takes at least a M5.2 to release a kilotonne.
It is currently around a 50/50 or even split in the top 25 quakes as to geolocation - west versus central and east to seafloor.
Clearly the much lower energy releases have extreme destructive potential, and anything over M7 is catastrophic if in an urban density.  

February 25 2013
Three of the largest quakes (M3.2-M3.9, from 8-12kms deep) in recent days have all occurred in Pegasus Bay showing renewed activation there.

March 13 2013
Quake energy across the region has declined since March 4 
Central city Red Zone footage taken recently shows the extent of the CBD still stuck in a time warp
The Press reports: 
The central city remains off-limits to residents.
The red zone, renamed the 'rebuild zone' by politicians, is expected to be reopened by June, although many areas will remain fenced off.


April 2013
The most recent 25 events March 27-April 9 -from M1.9 to M3.0
Coloured dots show variable depths. Though intensity & frequency have declined, recent activity is diverse across the region -north-south-east-west as shown on this clickable graphic from Quakemap

July 2013
After a lull mid May-mid June 2013, quake activity produced more energy in July, with more events over M3
July 29 2013
North Canterbury event felt in Christchurch
A M4.8 event , 9kms deep 20kms n/w of Culverden - south of Hanmer Springs -at 4.37pm confirms a new emphasis in the west and north of Christchurch - with more connection to faults associated with the major Alpine Fault - a specialty subject of Canterbury researcher Tom Robinson -video

PRESS news report July 29

August 2 2013
An uptick is evident in seismic energy output in the Canterbury region in the same time frame as significant quake activity is sustained in the Cook Strait region since July 19
M4.4 Swannanoa area around 4 am on this day
Last 100 quake snapshot from Quakelive shows widespread activity for events M3+ over the past 10 months

Update August 16 2013
This day saw a sudden resumption of high level seismic activity centred in Marlborough, with a M6.6 shake and strong aftershocks. This activity is consistent with the August -High Risk forecast published in June - which indicates further caution is recommended in the latter period of this month. Christchurch/Canterbury may well be registering resonant effects.
August report

update August 22 2013
Seismicity in the larger zone of Canterbury and northwards now figures prominently since the southward drift of quakes from the Seddon Sequence which began in July 2013.

This map segment from Geonet shows a background pattern over the past year with colour coding from grey to blue, green orange in increasing intensity - and does not include the Seddon quakes


September-October 2013
A largely unremarkable period with declining activity prevailing, many lull periods

November 2013
A pattern of very minimal activity interspersed with random higher events is continuing
November 18 M4.6 -via Quakelive
Monday 18 Nov 11.36pm M4.6 in suburban Christchurch, 137 tonnes, being the largest event in the region since October 1st 2013 M4.7 -  a seafloor event off New Brighton
report
This graphic section from Quakemap shows the pattern over the past year
No events over M5
November 18 2013 is the M4.6 event at extreme far right -and is the 3rd of this level in 12 months.


Sunday, 30 December 2012

Christchurch earthquakes: end of 2012 update

The end of 2012 sees a supposed slowdown in quake activity leading local scientists to announce:


"The probability of a large earthquake hitting Canterbury continues to decline as the earthquake sequence settles down, says GeoNet. Latest aftershock probabilities show the chance of a magnitude 5.0 to 5.4 aftershock happening in the next year is now at 69 per cent - compared to 71 per cent last month and 82 per cent in January.

There is now a 29 per cent chance of a magnitude 5.5 to 5.9 hitting before November 9, 2013, a 9 per cent possibility of a magnitude 6.0 to 6.4, and a 2 per cent chance of 6.5 to 6.9 aftershock.

There is just a 1 in 100 chance of another magnitude 7.0 or higher like the 7.1 which struck Darfield on September 4, 2010, sparking the Canterbury earthquake sequence."
 
 as reported in NZ Herald Nov 21, 2012

                                                                       click to enlarge
This graphic[ above] from canterburyquakelive
shows the enduring activity of the current sequence over the past year. It has had many more supposed decays and declines than any of the other sequences shown, followed by rebounds. The general trend looks to be down even to the non-specialist observer -but is that what is really going on?
To accept and believe in a clear and definite reduction, i.e. in effect a cessation in earthquake activity in the larger Canterbury region, may be too much to hope for, given the unusual and unexpected seismic features in the period since Sept 4 2010 and the unpredictability element associated with natural forces of this type.
The previously active Pegasus Bay area is seemingly quiet but as recently as June-mid November 2012 featured a string of quakes many would not be aware of (Canterburyquakelive graphic)
I continue to regard the Pegasus Bay area as a vulnerability, and to locals, the source of further unexpected activity, (the "hidden" factor of being sub-marine, not land based, a dark horse element if you like. Pegasus of course being the winged horse of Greek mythology).  There is a clear west to east progression in the aftershock sequences and in view of the current global condition of increasing extreme weather, and in the context of a holistic interpretation, associated geophysical stresses and strains are likely to be exacerbated, rather than lessened.
This consideration of the broader picture suggests a resumption of more significant seismic activity in the region may have a greater probability than standard models deduce.
As at Jan 2 2013, the last 100 quakes in Canterbury, M3.0 and over. See how the intense dark area is indicative of the amount of earth movement within a concentrated area, heading into the bay.
The very latest on Jan 2 was in Pegasus Bay (purple area) -source canterburyquakelive


Further reading: Background posts on this site reference the events in Canterbury in detail as well as some opinion re the pattern of unfoldment provided as an alternative viewpoint to standard scientific modelling. 
Refererence:
For some initial seismological data on the Canterbury Earthquakes refer to this video

Also read: 2013 updates on Canterbury-Christchurch earthquakes

Tuesday, 12 April 2011

Recent Quake Data -Christchurch NZ


Latest
This post is no longer updated due to other updated information located on this site
Please refer to:
Christchurch Shakes - for a running summary of seismic developments 
Christchurch -why warnings have been given - for commentary on the long term viability of Canterbury-Christchurch regarding potential future seismic hazards


Original post begins
Data sourced from the University of Canterbury's online quakemap  covering the time frame March 14-April 11 2011
The red box shows the highest mag aftershock for the day in the source area.
NOTES:
- this data may include events in the South Island beyond Christchurch & Canterbury, but significant ones are noted -eg March 23 the 3.9 event marked A occurred at the Alpine fault, west of the Canterbury region
- the highest magnitude event in Christchurch occurred on March 20 ( the dreaded Supermoon day)
- on April 11, a M5.1 occurred in the sea, east off the  lower North Island. This is the highest mag seismic event since March 20
- from March 16 the daily totals of events are given along the bottom border
- a general downward trend is expected by seismologists, in frequency and magnitude: though Geonet acknowledges
                    this has been a particularly rich sequence compared with the forecasts

As a matter of interest, considering there are so many very bright minds trying to unpick the mystery of where and when quakes occur, some options you can observe:

1. The moon's maximum north (N) or maximum south (S) declination is regarded as influential on seismic activity. A few dates coming up are:
April 8 (N), April 21 (S); May 6 (N), May 18 (S); June 2 (N), June 15 (S), June 29 (N); July 12 (S), July 27 (N)
The window of influence according to Richard Nolle is 30hrs either side of the target date 

2. A formula called tidal force - which combines a range of lunar factors, all of which are cyclic and therefore can merge in influence by several factors occurring within a reduced time-frame: a synergistic sun-moon effect is produced affecting the water and the crustal surface of the earth


For April the dates (column 4) from 13th to 21st are when the sun and moon together are said to exert their strongest combined force as shown by % in far right column.

This is not just a standard calculation related to New and Full Moons which are generally believed to be the strongest times of influence. In April, New Moon is 4th and Full Moon 18th
In April 2011 the full moon on the 18th coincides with a 94% tidal force, but the moon's position in latitude/declination is only a few degrees south of the equator (max south 21st) but it will be closest proximity to earth (perigee) 17th-18th.  I'd expect some increase in extreme weather/seismicity affecting areas that are usually active, but not a mega-event. May and June look more powerful.

Both theories have success as quake predictors  but both are imperfect in failing to get consistent results;

the Moon was near max North on March 11 - exact on March 12 -re the Japan quake
the Moon was 3 days off max South ( Feb 22 Christchurch quake vs  Feb 25 max)

the Boxing Day tsunami 2004 was Moon at max North and Full Moon -but Moon was at far apogee -so the tidal % was only 11. Clearly max. declination with full moon alignment were determining factors.

the Chile quake of Feb 27 2010 had the moon being beyond max north date (23rd) but it was right on lunar perigee and 1 day before full moon. The tidal percentage was 95. So here the tidal sun-moon effect seems to have ruled.
And more could be said concerning eclipses...next time.

Update April 15
NASA Science News site item suggests 2011 is seeing more solar activity directed towards earth - the solar wind comprising electrically charged plasma interacts with the magnetic field that surrounds earth ( essentially we live on a magnet!) The interesting point here is that on March 7 the sun send a big force towards earth, taking a few days to arrive here. It's arrival on March 10 was identified by the auroral lights and their spread - down to latitude 45N in some American states. 
And what happened on March 11 2011 in Japan? Some researchers are convinced that space-weather like this plays a significant role in earthquake activity.

Update April 16 a.m.
Noting an uptick in quake activity (21) events in the South Island on Friday 15th after a lull period as well as other activity in the North Island. Seeing as there are ebbs and flows in the nature of tidal behaviour the temptation is definitely there to find a link between quake activity and lunar/solar-lunar/other planetary cycles.
On Friday 15 the tidal force % was 97% -highest for the month, also 2 days before exact perigee and 3 days before full moon, then moon will be maximum south on 21st. A turbulent period would be expected in this time frame April 14-22.
What's happening globally? The M5+ records show more diverse action has been building, compared to Japan's recent near total domination of the stats. Note Tonga is quite active = closer to home. Nevada at latitude 38N, since April 10, has repeated small events like currently seen in Christchurch.
Globally the latitude bands 30-40 degrees north or south of the equator appear to be dominant as detected in a prior analysis posted by Waiheke News on worst earthquake zones

p.m. The largest aftershock since Feb 22 occurred in Christchurch at 5.49 pm, in the seafloor, Diamond Harbour, M5.3 ( prior highest was March 20) 
Currently 2 days from Full Moon; tidal force is very high 96%; one day before the moon's perigee position and the moon is on the other sensitive latitude/declination in space = on the equator.
P.S. you won't hear Ken Ring go to the media this time but he did warn of this period: will post if the link can be located. Found it - a global chart indicating M5+ activity today around the world - here

Update Monday April 18
"We are locating events under Darfield, under Lyttelton, and all the way out to the coast. It is still a very active area."
The shocks are gradually becoming smaller and further apart, but would not stop completely until around February 2013.
...the probability of an earthquake of magnitude 6 or greater within the next year was roughly 6 per cent     NZ Herald report April 18

Please read prior and upcoming posts on this topic to ensure you are factoring in the reality of the situation in Christchurch. 

Update April 24
A M4.3 in Lincoln, Chch at 8.51pm

Update May 10
If the highest quake of the day occurred outside of Canterbury, it is indicated as Seafloor, Alpine or Marlborough. On April 30 it is shown that a 3.9 occurred in Chch, but a 5.2 occurred in the Alpine region.

This data shows the trend, with number of quakes per day along the bottom border, showing a lowering of totals and a bunching of smaller mag quakes, down to a max of M3 on May 3.
An uptick may be observed from May 5, when the energy built. The next event, which occurs the day after the 9th, ie May 10th a M5.3 in Rolleston, shows a sudden surge of energy, but this location, Rolleston saw the M4 max on May 9. So whilst the general trend is down, the recurrence of shallow events over M5 must be of concern to residents. (GNS forecast data)

Mouse-over this quake data graph as well for more info.

Update May 16
Today's events included an unusual sequence of  3 events M4.0-4.6, 2 in the seafloor, 1 south of Springston 

Dec 16 2011: 
The downtrend evident in the Quakelive graph  [-just prior to a fourth sequence occurred]
Quakelive data  - click to enlarge
 
 On Dec 23 2011 a fourth quake sequence began, due to a M5.8  in Pegasus Bay. Details and ongoing commentary re this location are found in this specific post


Uranus Pluto and Pandora's Box

Technical wizardry devoid of wisdom  is more a curse than a blessing This has never been truer than now in the context of rapid-paced AI ev...