Over 400 dedicated posts are searchable by keyword in the column under Archived Posts. DIARY POST is where the short form and snippets are regularly added. This site now replaces content provided to X.com.
Earlier work includes astrological profiles of criminal offenders planetary cycles and favourite research areas such as extreme weather solar dynamics including spaceweather.
Typically there is no single planet or cycle resonant with major events but any standout factor/s are worth pinpointing. Outer transits and cycles accompanying an observed cycle will always be worth tracking to assess their contributions.
Though a few of those extra factors are noted here this analysis is more focussed: the economic waves and troughs that are signalled by Saturn aspecting Neptune.
An examination of 4 global recessions within recent decades – the early 70s 80s 90s and 00s points to structural weakening related to major stages in the Saturn-Neptune cycle. What is clear is that the decline in material integrity – the collapse of a structure of functioning within the world is well described by the imbalance of Saturn and Neptune in our human consciousness - and that such processes are a natural cyclic recurrence
Saturn in Neptune’s sign Pisces is also worth observing
Saturn being aligned with Cardinal traits is inherently oriented towards maintaining balance building fundamentals and securing a firm foundation.
Neptune being Mutable is the great dissolver – intent on dematerializing what Saturn builds.
Clearly a mismatch is emphasised whenever this pair meet up.
Saturn is our guide to functioning in a physical plane of existence – how to succeed in the world.
Neptune is our origin and return state devoid of materiality.
Essentially the message is: how do we utilize Saturn to be in the world – while being “not of it” – how to walk both paths how to find the balance?
This problem plagues humanity and so periodically Neptune shows up to give Saturn a tap on the shoulder. Uranus tends to play for both sides when a standoff arises – sometimes in support of Saturn other times in rebellion.
Other factors like Uranus and Pluto also play a significant disruptive or annihilating role that can be seen to work alongside a Saturn-Neptune transit.
Uranus in Taurus during WW2 disrupted not only food supplies leading to rationing – but also fuel [ fuel: petrol gas oil are all associated with Neptune]
UK rationing intensified in 1942 under a Saturn-Uranus in Taurus conjunction. 1944-45 saw three Saturn-Neptune squares
Uranus in Taurus in the 2020s has responded both to the global contagion of the Covid-19 virus [Neptune] and to a different war in Europe -the invasion and assault of Ukraine since February 2022 both of which ceased/delayed/restricted functioning of global supply chains: Uranus enjoys a good disruption a sharp jolt to your comfort level. The increased cost of fuel – adding further expense to goods and airfreight means that supplies of imported products remain subject to ongoing restraints in 2023 – we have returned to reliance upon literal shipping – the longer slower version of transport – the Saturn-Neptune large container ship across oceans option. The brakes are already being applied in the system of global trade.
Global Recession Factors
Focussing on Saturn and Neptune and the timing of 4 most recent globally relevant recessionary periods – the determining state of affairs re the global economy points to GDP contraction and weakening signs in economic activity underway when those recessions arose.
Events do not manifest in full like a resonating bell simply on the date of an exact transit. The exact transit sets the theme which over time bears fruit and is triggered by a variety of other prevailing transits. The complexity of this often gives multiple options - which demands the sort of sustained microanalysis that few choose to apply. The lesser option involves finding patterns and seeing when there is high potential for a resonance that enables a close repeat of the past.
First we look backwards from a manifestation period
because it is clear that dates are somewhat arbitrary
and the fact
that nothing fruits before several stages of development
at time of writing in May 2023 Brent is around $US75
A much higher price in 2022 contributed to higher inflation
1. 1973-1975 – ”First oil shock”: the oil crisis continued to impact economies due to increasing oil prices/oil embargo. Hyperinflation occurred in goods & services. Much jostling for control re oil occurred in the 1950s prior to OPEC formation in 1960 Key transits: Suez crisis 1956 Saturn semisextile Neptune; Saturn square Pluto. April 1972 Saturn opposite Neptune. Uranus and Neptune both in fixed signs. This illustrates the sort of extra detail that can be mined. Next just tracking Saturn-Neptune:
2. 1980-1981 – “second oil shock” drop in oil production. Key transit: Saturn triple square Neptune September 1979 and March and June 1980
3. 1990-1991 – background of high inflation consumer pessimism then Iraq invasion of Kuwait and high oil prices. Key transit: Saturn conjunct Neptune occurred 3x in 1989 with the last in November 1989. [1989 saw aggressive rate hikes by the US Federal Reserve under the Capricorn conjunctions ]
4. 2007-2009 – Global Financial Crisis Key transit: Saturn opposite Neptune August-September 2006 and February to July 2007. The oil price peaked in 2006-2007
In this list the main transits are 2 oppositions one conjunction and one square but the so-called minor aspects are definitely part of the processes bewteen these two planets.
Prior Saturn-Neptune oppositions within the past century were 1936-1937.
Squares occur more often – around every 16-18 years and include 1944-1945 and 2033-2034,
Conjunctions arise around 36 year periods, Sequences of 3 conjunctions also arose in 1846 and 1952-1953, The next is early in 2026.
Interest Rates
Here is where the less noted aspects seem to cluster.
Interest rates were very high in 1980-1981 but dropped after July 1981
Impactful on drop points were:
June 1980 SAT-NEP squ & Dec 1980-July 1981 Saturn conjunct Jupiter
June1983 SAT-NEP sxt
Aug 1986 SAT-NEP semisxt
Feb 93 URA-NEP semisxt SAT
Sept 2003 SAT qncx NEP
Dec 2008 SAT-NEP qncx
Nov 2019 SAT-NEP sxt
Apr 2022 SAT-NEP semisxt
After April 2022 the sharpest [fastest ]interest rate rise since 1980s visually at around 80 degree angle…reducing to 75 degree somewhere close to Dec 2022
The next angle is the Feb 2026 SAT-NEP conjunction
which has not featured in rate drop points since 1980.
Nor has the opposition.
In 2006-2007 rates were very similar to 2022-23 around 5%
[ last SAT-NEP opposition ]
In 1989 [triple conjunctions] As inflation climbed the US FED aggressively hiked interest rates - a peak after the 1986 semisextile
Tax Cuts
Pluto in Virgo opposite Saturn in Pisces in the 1960s saw corporate tax cuts under JFK which helped expand the economy - the well known prosperity of the 1960s.
Hyperinflation
Early 1920s Europe hyperinflation [Germany] was preceded by Oct 1921 Saturn semisquare Neptune and Uranus trined by Pluto [URA PIS - PLU CAN]
1923 peak Saturn sextile Neptune.
The practical cause of hyperinflation for Germany began with the expense of the war onset - declared August 1914.
SAT formed an applying semisextile to NEP [SAT GEM NEP CAN ] when war was declared.
Then SAT-NEP reached conjunction in Leo Aug 1917 3 years of the financial burden of war having been endured and with one year of war to still play out.
Another 3 years later - August 1920 the separating semisextile in Virgo-Leo
The hyperinflation in Germany was locked in in 1914 and peaked in 2023 according to the referenced source below.
The Future
In the 2020s
January 2023 had the applying semisextile SAT AQU to NEP PIS
In this era the cost of human warfare along with the huge expense
of the natural warfare of extreme climate events
[especially flooding with the Pisces emphasis]
These events may by 2026 bring some resonance with the WW1 era
- nations effectively bankrupted.
Saturn conjuncts Neptune in Aries February 2026
Again neatly 3 years after the semisextile.
The separating semisextile arises November 2029
Saturn in Taurus Neptune in Aries
A century after the October 1929 sharemarket crash in the US
Latest: Financial analyst James Rickards predictions, expounded in a series of titles indicate that structural collapse of the global financial system is inevitable -and in fact being promoted by a cabal of operators within the top echelons of the global financial network, whose mission is to establish the One World, one currency agenda.
March-April 2017 the downward trend is noted in diverse financial analyses...[1] [2] [3]
The Great China Famine 1958-1961
occurred in conjunction with planetary influences which began to repeat in 2015 involving economic slowdown combined with environmental adversity affecting production and will unfold into austerity in the subsequent years 2016, 2017, 2018, 2019
The content of this post has been sourced from and updated based on a November 17 2013 entry on this site about the decline of the West
The Consequences The scale of impact gives rise to considerations of an economic meltdown impacting the world -but which originates in China -not in the West as many expect. Global effects are now the consequence of globalisation & the expanded footprint China has in multiple countries
Astrological indicators in detail
Planetary positions & aspect grid for Nov 7 1931 China Soviet regime
Referencing the China Soviet chart dated Nov 7 1931: I believe the austerity, famine, drought, large scale transformational energy of this chart* was activated during the Great China Famine 1958-1961 - and because of repeating patterns, that adverse economic & environmental conditions will be activated again in the period starting in the middle of 2015, further strengthening from March 2016, noticeably as 2017 begins, throughout 2017, sustained through 2018, 2019
*[Saturn 18 Capricorn opposite Pluto 22 Cancer both square Uranus 16 Aries. All aspecting Jupiter 21 Leo. 19 degrees is a critical activating midpoint ]
This era though does differ from 57-60 years ago due to a
different economic base. This is no protection from the adverse
energies. Impacts upon growth & production have relevance across all
sectors from land-based productivity, to goods & services based and commodities & therefore the whole
economy.
The Timing: late May 2015Uranus reached 19 Aries -a trigger of change in the economic balance. Jupiter in China Soviet chart is 20’58 Leo Jupiter at end of June 2015 was 21 Leo
Jupiter’s link to the Saturn-Pluto-Uranus trio in the Soviet chart identifies the potentials for swing from feast to famine. Nodal axis in China Soviet chart is 4’58 Aries-Libra.
Nodal axis at start of July 2015 is 5 Libra-Aries
The nodal axis is a significant societal indicator and Libra is the scales needing to be balanced The Energy Re-visited: The process begins from 2015 with Uranus, Pluto and Saturn all activating the 16-22 degrees of the cardinal signs Aries and Capricorn The spectre of drought or crop failure-related food shortages and severe reductions in general production is revisited with Saturn passing through the growth and production sign Sagittarius in the period 2015-2017 then austerity related effects with Saturn in Capricorn 2017-2020. This era though does differ from 57-60 years ago due to a different economic base. This is no protection from the adverse energies. Growth & production impacts have relevance across all sectors from land-based, to company based & therefore the whole economy.
The Deeper Meaning: Activations of the cardinal signs Aries, Libra, Cancer, Capricorn signify gross imbalances come to light and must be corrected. Humanity faces the agenda preprogrammed by natural and collective forces Transformations:With Sun-Mercury-Venus in Scorpio in the China-Soviet chart, transformational periods are very natural in the course of China's modern history.
2016 Updates
After a dramatic market slump in China mid 2015, considerable government intervention was put in place to try to staunch the bleeding.
The massive loss of capital overseas has also led to Chinese restrictions on the outflow in the latter part of 2015 into early 2016.
Market turmoil resumed globally at the New Year -even before the economically shaky Year of the Monkey was ushered in.
No stability has been witnessed in the first 5 weeks of 2016. Volatility is the name of the game and the next period of deepening threat arises in March 2016 when multiple factors could spell trouble.
2016 has the same eclipse positions as in 1997 when the last Asian economic crisis occurred.
Both 1997 and 2016 have a total solar eclipse on March 9 .
Events in March will be precursors to the Sept-Oct 2016 events.
In October 1997 markets dropped in the range 2%-7.7%.
Let's see what happens this time.
The Saturn to Jupiter angle of 90 degrees is indicative, in late March 2016 of constrained growth, restricted freedom, restricted movement.
Unemployment spikes, mass job layoffs, closures, travel restrictions, borders tightened. Economic implications are unavoidable under these conditions. These themes will affect all of us in some way to some degree in the March, April, May, June 2016 months leading into further restrictive situations strongly arising in September, October
Observing any synchronous connections between global markets and other mass behaviour, in concert with strong solar output impacting earth. (conversely when solar activity impacting earth is low, less disturbance may stabilize markets, on account of human behaviour. Updates will continue to be added to this page, but a cached copy of the original post has now been lost
With a smaller M3.3 flare on April 12 20:38 UT adding to recent higher than recent average solar activity markets have been shown declines: April 13 BBC listings:
April 12 2013
Watch April 13-14 for geostorm potentials in the wake of the M6.5 flare & CME on the sun at 07.16 UT on April 11 -the most significant earth-directed flare in several months. Dow Jones has been breaking records and a switch may be in the wings
March 18 2013
This
graphic shoes how earth's geomagnetic field shot into the red zone on
March 17 following the filament eruption-CME on the sun around 48 hrs
prior.
The spaceweather modelling animation sourced here shows a full envelopment of earth in the solar charged material.
In terms of extended analysis beyond the mainstream view of disturbances to GPS, satellite, electronics, in the wake of such an event, in simple terms,expect drama - since the earth itself, weather, biological systems - i.e. natural forces and living beingsare
all bathed in the highly charged electrical soup and therefore
vulnerable to effects. Increased seismic-volcanic activity expected.
Weather more disturbed. Prior events of energetic storming on earth show
a spike in inflamed, explosive, combustible energies -reflected in
fires, bombs, military responses, more news with crimes based on anger,
aggression, violence; animals attacking humans; strongly collective or hive-mind activity such as in mass protests and market behaviour.
[ updated graphs as above will be added when released]
March 17 2013
A geomagnetic sudden impulse was recorded in the earth environment on this day, recorded as a strong impact & occurring 2 days after a full halo coronal mass ejection left the sun following the extended eruption of a magnetic filament. Watch and see any flow on effects from this heightened activity.
March 5 2013
A leap in markets - with Dow jones at a new all-time high of 14,259 -report .
This may reflect in terms of solar activity factors, such an unusually long lull in perturbing factors. But interestingly, the sun on the same day, March 5 produced an M1 flare on the earth facing side but also a massive CME on the far side.
In terms of positioning, Earth is in the next orbital ring beyond Venus but it is currently on March 5 2013 in the region of the left horizonal arrow & out of view, more clearly shown in this March 5 Fourmilabgraphic [ circle with inner cross = earth]
Let's see if there's a sudden reversal of fortunes in coming days as the solar wind hits earth as projected by this graphic [ full animation at source site - note: will expire ]
Click to enlarge & see how green earth dot is in the swirl on & around March 9
Jittery markets ( Italy, Asia, US) but no massive slump as Italy fails to get a clear election result.
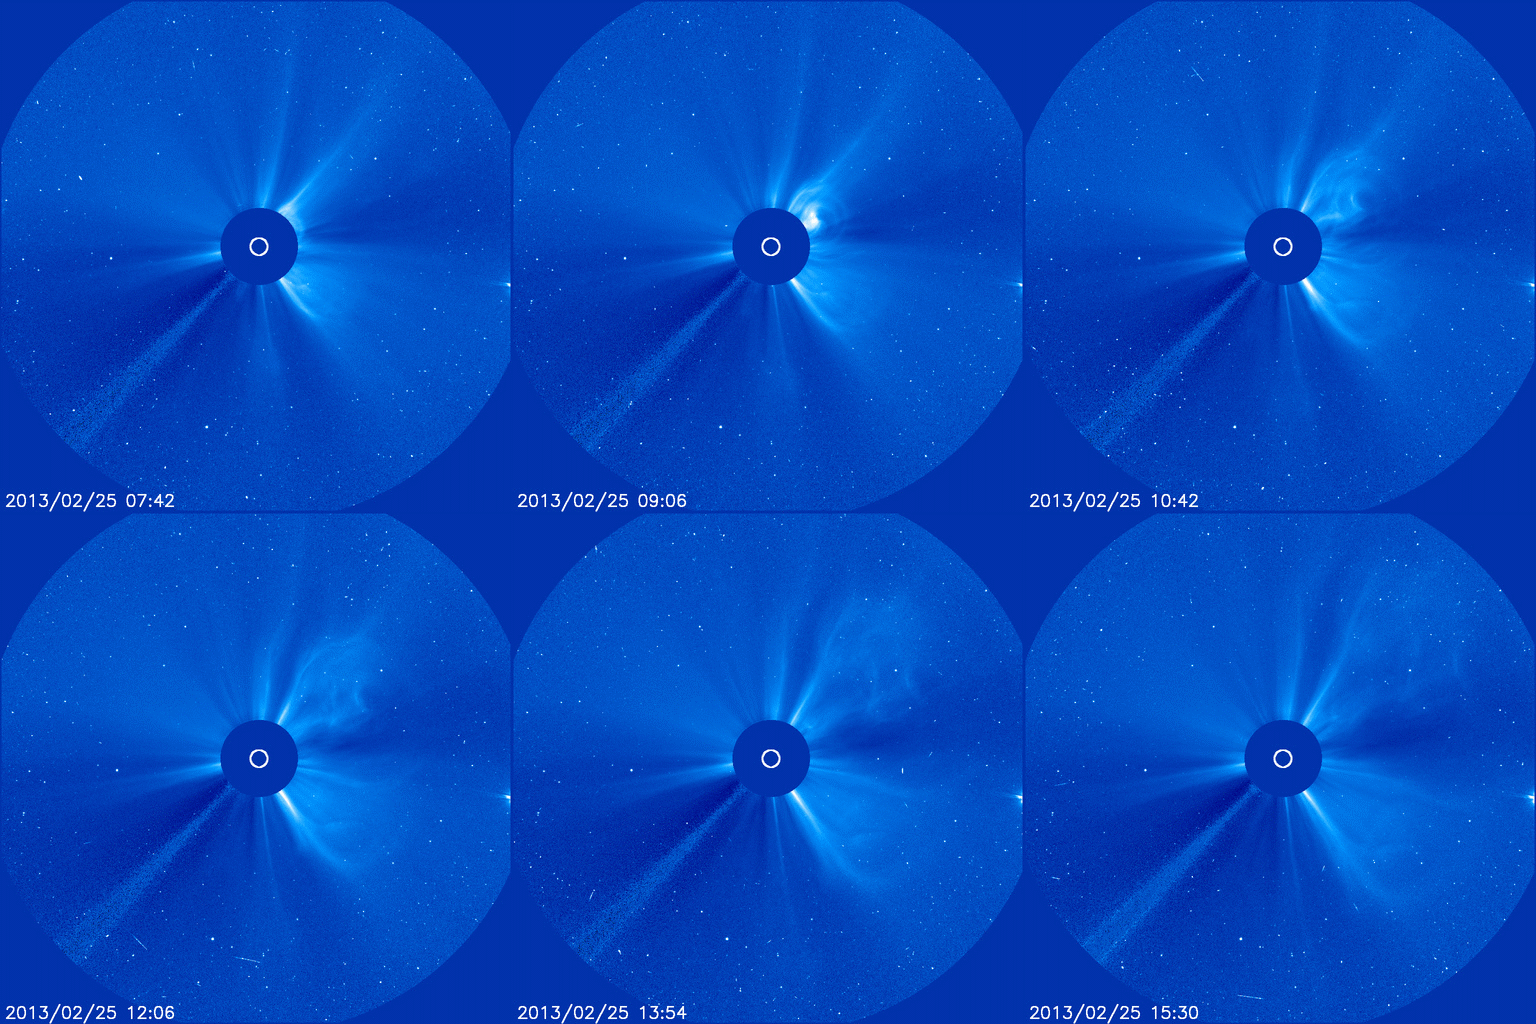
Solar activity remains low in past several months, in terms of flare activity but the question remains re other solar output -such as the Coronal Mass Ejection of February 25 2013 - seen in this video.CME. Since it occurred on the sun's far side the traditional view is No Earth Impact but keeping an open mind may prove more useful..This broader space view -an animated modelsuggests earth is way off range, but science continues to discover prior unknown aspects of astrophysics - with the most subtle likely to be the last uncovered.
July 1 2012
By the end of June sunspot 1513 has delivered 3 M flares since June 28. In addition, a large coronal hole and significant prominence are indicating a sudden uptick in potentially geo-effective solar activity. Earth's magnetic readings have risen on June 30 UT:
June 24 2012
The unusually sluggish patterns of solar cycle 24 continue - with less happening rather than more - as we head to sunspot maximum in 2013, this cycle is looking like other historic lows -refer tosolen graph.
Less spots, less, flares, are only part of the picture though, as the sun can produce filaments of magnetism with associated CMEs and large coronal holes emit powerful high speed wind which has geoeffective potential when earth facing and plugged in to our planet when a southward polarity of the Interplanetary Magnetic Field prevails for an extended period. It's a watch period from now until maximum around May 2013 to see just how much spark the sun will deliver to us in this phase of the cycle before the next decline.
June 16 2012
Spaceweather sources report that only a weak interplanetary shock wave impacted earth at 09:00 UT with no geostorming.
June 15 2012
A second long duration CME out of sunspot 1504 reinforces the potency of this large, currently earth facing, magnetic crucible. A M1.9 flare occurred as the precursor to the CME, on June 14 at 14.36 UT.
The close proximity to the prior CME out of spot 1504 on June 13 ( M1.2 flare) means the high speed solar wind has combined. The 2nd CME sent wind at 1360km/sec according to spaceweather.com.
If the IMF tips persistently south when the combined wind arrives around June 16, then strong geostorming will result with subsequent potential disturbance to any natural & man-made systems.
On June 18 the moon is in maximum north declination relative to thje earth. On June 20 there is a New Moon. These extra geophysical stress factors may synergistically combine with effects from the highly charged earth radiation belts once the solar wind reaches earth
June 14 2012 Mainly a quiet phase involving low level C flares and sporadic M flares with few geo-effective indicators on the usual indices. Only June 11-12 saw 6 hrs of level 5 readings on the Kp index -meaning May and June so far have been underwhelming. Even with recent large coronal holes and high speed solar wind there has rarely been much observed plug-in to earth in the past 6 weeks. Low level M flares occurred on June 6, June 9, June 13 & it is difficult to conclusively say what effect any of these could be having other than adding general turbulence. A significant X flare with geoeffective CME or large coronal hole with earth-facing high speed wind is awaited for comparison in terms of global flow on disturbance.
June 4 2012 Solar activity wakes up as the Dow plunges
The earth based readings reflect recent prior solar activity
a 3.3 M-flare on June 3 UT will add to effects of a high speed solar wind stream heading for earth ETA June4-6.
Coronal Hole CH520 is large and earth facing - sending charged wind in earth's direction This increased activity coincides with a lunar eclipse supermoon [ = close perigee] in maximum south declination, enhancing solar-lunar potentials in geoeffective events. (June 2012 eclipse)
May 31 2012
Ongoing very low solar activity is being noted.
May 17 2012
Sunspot 1476 underwhelmed solar watchers until a long duration M5.1 flare today - right at the edge of rotation
The sudden vertical spike at around 01.30 hrs UT with subsequent CME, causing a radiation storm of solar protons around earth. Speeds exceeded 1500km/sec. There was also a far-side [ back of sun] CME also today, around 1600 hrs UT - see the red trace rise there.
This solar activity is coinciding with worsening economic news. For a full forecast see May 2012 lunar & eclipse post. It's important.
May 9 2012
Market declines have coincided not only with the election of Francois Hollande in France & the Greek crisis, but also with an uptick in solar activity related to a large coronal hole high speedstream and the magnetic fireworks related to massive sunspot 1476 this week. Things could get very interesting if the readings below shoot to the X category on the right hand scale in the next 7 or so days. Watch the markets in the further 10-14 days ahead
The peaks in the red trace represent several higher intensity flares from earth-facing sunspots from May 7-10 2012.
solar disc late May 8 2012 - red coronal holes and spot 1476 very clear.
Recent readings compiled by NOAA SWPC from various northern hemisphere locations plus the estimated planetary readings compared:
This phase could have more steam left in it if sunspot 1465 erupts Worth watching to see if any market effects ensue April 24 [UT] 2012 The last significant geoeffective activated phase was on April 13.
Ten days later the sun has sent material in earth's direction, which has "plugged in" effectively in the time from 03:25 UT on April 23 to present 03:10 UT on April 24
News is in of a world share/stock market drop - report
Geomagnetic data up to end of day April 23 2012 shows the progression to red-bar storm level disturbance. The first 3 hours of April 24 UT have seen the level reach K6 -
April 15 2012 Watching solar activity in case of an upsurge in flares, CMEs, - this is an ongoing link so material relevant to April 2012 will soon expire, as daily updates on the solen site proceed April 11 2012 Markets have been more down than up in the aftermath of March's sustained solar onslaught against planet earth. Since the start of April, little geomagnetic interference from solar output. BBC today:
March 30 2012 Nothing dramatic market wise but theRussian situation has been a bit shaky March 23 2012 This has been an interesting solar flare-CME-High Speed Solar Stream combo period, with the last M flare on March 17. The extended onslaught clearly churned up the geomagnetic field as evidenced by the strong spate of auroras. In Norway by March 22, March had aurora on 18 nights. By March 23 global markets are down, though not a horror show.
NASA analysed
geomagnetically disturbed days on earth over a 75 yr period and they now
consider the spring and fall or autumn equinoxes (equal day-night points)
of March & September to herald the greater frequency of
disturbances and auroras, extending in to April-October: March tops the data, followed by October, April then September.
Feed these four months into a statistical calculation after you read the list of stock market crashes. As a group they feature very highly, with October being particularly prominent - eg 1907, 1929, 1987, 1989, 1992, 1997, 2002. This if course doesn't mean the next big crash will happen in October - a big momentum of solar activity coincided with the August 2011 slump. Best policy is to keep watching the sun as we enter the maximum phase of Cycle 24
March 12 2012
South pointing polarity has occurred quite consistently but the full strength of recent flare events is past.
This list of strongest flares since 2010 ( prior to that was a lengthy lull) gives clear indicators of why August-September 2011 was significant in terms of global markets
August 3-Sept 24 2011 saw a swarm of strong flares ( along with many smaller) Most of these associated with a Coronal Mass Ejection and 6 of the eleven events produced a strong to severe geomagnetic storm (G3-4) This sort of intensity is probably what is required to send the markets into a panic. A summary so far of geomagnetic storms in sunspot Cycle 24: September 2011 stands out having 6 geomagnetic storms in one calendar month - see full data in prior list
March 9 2012
The full potentials of the current solar storm are yet to be realised as the solar field is not fully plugged in to earth. For full effects the solar magnetic field needs to be in negative [south] polarity. For the most part this has not happened. When negative, the field can strongly flow into earth's magnetic environment.
Follow the red trace to see when it dips - and stays persistently - south of the midline - Solar Wind data
At 21.40 UT March 8 this is the screenshot:
March 8
Indicators already apparent regarding the beginning of major geomagnetic effects due to persistent flaring on the sun. Power systems, GPS, satellites and biological systems all vulnerable to disruption / disturbance. Watch from March 7 (UT Universal Time) as the first wave of effects impact earth, what unfolds in global markets as well.
March 7 2012 (NZT) A flurry of flares continues including now an X5.4 off of sunspot 1429 bringing the most consistent flare delivery for some considerable time & more expected. As anticipated there has already been significant market dip news -this from the US
Today 4.58 pm local time the first X flare for 2012 (X1.1) The most recent prior X flare was in Nov 2011 - X1.9 Lets see if the geoeffective consequences are significant enough to disturb human behaviour - and the financial markets
Feb 24 2012
Solar activity has been remarkably subdued with flatlining occurring on the X-Ray graphs fromGOES.
Very little geoeffective activity and no significant global market news.
The largest flare in 2012 so far was on Jan 23 = M8.7 = almost an X
Feb 2 2012
No significant news from the global sharemarkets and the sun has had moderate geoeffective output.
Recap: Jan 14 saw first M flare (M1.0) for 2012; Jan 23 saw largest flare (M8.7). We have not seen an X flare for months. Also refer to data provided by SolarHam
Jan17 2012
Since last report, just two low level M class flares - latest Jan 17, M1.0
No geomagnetic storms for some time
Jan 4 2012
Since New Year 2012, geo-effective solar activity has declined back gradually to B class level. Stockmarkets generally & those in US, China have opened positively.
Dec 30
As anticipated, an M class flare from sunspot 1389 on Dec 29 UT amidst a flurry of C flares. then just in, a second M flare as pictured below. More expected. So far nothing has impacted the geomagnetic field. US market is up.
This pattern is a big change from recent flatlining of the orange band along the base, and the red band equally dormant in the B class
Magnetic Readings on earth have yet to reach Red(Storm) level Website
Dec 29
Sustained C class flares on Dec 27, 28. Markets are now down but no significant slump is expected until flares return to sustained M class or especially X class, with resultant geoeffective turbulence. Charged solar wind from a large solar coronal hole is about to reach earth at year's end. The solar wind's magnetic field (Bz component) is currently in North polarity at 0hr UT - which is not the most geoeffective. Incoming solar material disturbs earth most when the Bz is South.
Sunspot group 1389 promises bigger flare /CME action.
Dec 27 Now three M class flares since Xmas Day 2011
Now two M flares - may precede a bigger X flare.
A smaller M1.5 flare on Dec 26 hot on the heels of:
The largest flare for weeks: M4.0 at 18.16 Universal Time on Christmas Day, coinciding with a complex of solar-lunar-other planetary tensions. Has sent an earth directed CME, incoming around Dec 28 UTC. May not be strong enough to scare the markets!
Dec 13 Watch Dec 18-19 to see if there's geo-effective space turbulence affecting the markets as there's certainly "economic dampner" "financial drain" "money worries" planetary influences on those days. Dec 7-Dec 13 2011 Still no significant geoeffective activity to report, during this unexpectedly lingering phase of relative quiet on the sun. The spots keep coming and they keep promising/threatening, but then they degrade. After this phase, the pattern breaker when it comes could be significant in terms of upsetting the current very fragile equilibrium in the global markets. Meanwhile here's an easy to followexplanation of earth directed solar material There is an imminent eclipse in the wings - total lunar visible in the southern hemisphere coinciding with the moon at maximum north declination in respect of the earth. These factors can trigger turbulence. Exactitude is Dec 10 though the building phase & aftermath phase makes for a period of Dec 7-13 to watch. Also take note of the December solstice when the Sun is at zero degrees of the cardinal sign Capricorn and therefore one of the traditional four seasonal markers. This year the Moon is perigee (closest orb for the month) on Dec 22. Solstice is also on Dec 22. Moon is maximum south on Dec 23 and the New Moon is on the 24th. So this is a whole bunch of factors all compressing into a brief time frame. One source I follow is suggesting there will be enough strain generated to have significant impact on the tectonic state of the planet with significant seismic consequences. Watch and see if the sun gets more active and human behaviour in general and market activity are perturbed by the highly charged atmosphere.
Nov 28 Flares remain low level but the sun is not quiet. Geomagnetic storming is anticipated today: spaceweather.com says: A solar radiation storm is in progress around Earth. At the moment, the storm is classified as minor, which means it has little effect on our planet other than to disturb HF radio transmissions at high latitudes. Bigger effects, however, may be in the offing. The same explosion on Nov. 26th that caused the radiation storm also hurled a CME into space at about 930 km/s (2 million mph). According to analysts at the Goddard Space Weather Lab, the CME will reach Earth on Nov. 28th at17:21 UT (+/- 7 hours).
In adddition after an extended period of no coronal holes, solar wind from a current hole is expected on Nov 29 which may be evidenced by geophysical turbulence.
Nov 24 - Only C class activity since the last update, but on Tuesday 22 (Universal Time) three CME's were emitted from the far side of the sun. As not perceived as earth-directed, mainstream science says irrelevant to earth. But last time I looked there was no wall or fences stopping perturbations spreading across space and having some earth impact. Between 23-26 Nov there is perigee moon, new moon partial solar eclipse and moon at max south declination = 3 strong gravational or tidal synergies in a brief time span, so space weather impacts on earth weather and human responses are anticipated. in this time frameup to next week in particular. Nov 16 - Levels picking up hovering under/over M-class levels - NOAA graphic:
Nov 13 The geomagnetic response to the CME was low but solar watchers are focussed on a giant plasma filament - full report Nov 12 C5 level flare spikes on the 11th but nothing breaching the M class range. A CME is incoming and expected to produce a moderate geomagnetic storm
Nov 11 NOAA saysAn increase to quiet to unsettled levels is expected on day 2 (11 November) as the effects of a CME, from 08 November, are forecast. An increase to unsettled to active conditions on day 3 (12 November) is expected, as the CME, associated with today's M1 flare, is expected to become geoeffective.(CME =coronal mass ejection of charged material from the sun)
Nov 10 Flare activity on Nov 9 up to M class level after a lull period, has coincided with the Dow dropping 388 points - MARKET REPORT
This NOAA proton graph shows the decline
and from Solar Ham: A moderate Solar Flare reaching M1.1 took place at 13:35 UTC Wednesday morning around Sunspot 1342 which is located in the northeast quadrant. It now looks like a Coronal Mass Ejection (CME) resulted and a portion of it may be Earth Directed.
Bear in mind that energetic protons can reach earth as quickly as 30 mins after the peak of a major flare.
Nov 8
The recent solar flare activity was not sufficiently earth-directed to create a geomagnetic storm and resulting energetic turbulence. X-ray flux has declined since the graph below and no further M flares have occurred up to late Monday Universal Time (UTC) but watchers expect more from sunspot group 1339. Markets too are in a holding pattern.
click to enlarge NOAA GOES X-Ray flux graph
After an X-flare in recent days, several M flares have occurred.
Sunspot 1339 is a large grouping & is under observation.
November 6
November 2011 has begun strongly in terms of reinvigorated solar output after a quiet October with no X flares. This week could offer a big burst of activity, so lets see how the global markets & mass behaviour are responding.
The premise outlined in my original, lost document, was whether high solar output has an effect on global sharemarkets and other mass behaviour -since both involve, in effect, a group mind phenomenon, which could be "spooked" by strong electromagnetic impulses -as when the earth receives a strong feed of protons, electrons as a result of solar activity.