Over 400 dedicated posts are searchable by keyword in the column under Archived Posts. DIARY POST is where the short form and snippets are regularly added. This site now replaces content provided to X.com.
Earlier work includes astrological profiles of criminal offenders planetary cycles and favourite research areas such as extreme weather solar dynamics including spaceweather.
As noted in my prior posts on August 2011 ( here and here ) this has been a dramatic month, as befits the solar force, personified through LEO.
Next up after the full moon and before the Virgo New Moon on the 29th, Saturn and Mars both interact with Sun opposing Neptune at the tail end of Leo-Aquarius.
Looking at the 23rd-24th when Sun 29.30 Leo opposes Neptune 29.30 Aquarius, Saturn at 14.20 Libra will closely aspect both (semisquare/sequiquadrate) These often overlooked and sometimes designated "minor" aspects can have a lot more of a power punch than expected, so with Saturn involved, forget about any "semi" considerations and give the aspect a challenging role to play.
Then look at Mars in Cancer - building to an exact square to Saturn on the 25th and so capable of energising the potentials of the Saturn-Sun-Neptune combo, since Mars itself will reach also an exact semisquare/sequiquadrate to the Sun-Neptune pairing.
Interpretative possibilities range from collective humanitarian impulses, people yearning for a better world of social justice (Neptune in Aquarius) facing off against despotic, authoritarian people/systems (Leo Sun-Saturn Libra mix). An angry public (Mars in Libra) facing repressive or controlling(Saturn in Libra) dictates. On a private level -relationship and domestic strife where one participant seeks to escape one-to-one partnership issues in favour of friendship and group fun and support.
We are already seeing pockets of this globally within the context of the widespread pro-democracy movements and these new surges of energy will manifest in people and places that most closely correspond vibrationally to the particular energy mix.
In economic terms - more strain on the global sharemarket could arise due to Neptune aggravating Saturn's tendency to worry, into a state of panic (Neptune causes the imagination to run wild). This is the sort of scenario that leads to contagion in the markets, as the energy ripples out like a stone tossed into a pond. ( update Aug 26 -US markets have instead surged in a mood of "wishful thinking"with the hope that Bernanke can "wave a magic wand". Neptune is the indicator of magic so it looks like the collective choice has been to flip from dominant Saturn (worry) to dominant Neptune (fantasy) as often happens when the truth is too hard to bear.)
August 22
Clearly events in Libya are most closely representing the pro democracy surge
August 24
USA East coast regions are facing two powerful acts of nature: the unusual M5.8 quake (rare in that region) and shallow -meaning more widespread shaking. See the astrology of this event Hurricane Irene is also causing concern
Observing any synchronous connections between global markets and other mass behaviour, in concert with strong solar output impacting earth. (conversely when solar activity impacting earth is low, less disturbance may stabilize markets, on account of human behaviour. Updates will continue to be added to this page, but a cached copy of the original post has now been lost
With a smaller M3.3 flare on April 12 20:38 UT adding to recent higher than recent average solar activity markets have been shown declines: April 13 BBC listings:
April 12 2013
Watch April 13-14 for geostorm potentials in the wake of the M6.5 flare & CME on the sun at 07.16 UT on April 11 -the most significant earth-directed flare in several months. Dow Jones has been breaking records and a switch may be in the wings
March 18 2013
This
graphic shoes how earth's geomagnetic field shot into the red zone on
March 17 following the filament eruption-CME on the sun around 48 hrs
prior.
The spaceweather modelling animation sourced here shows a full envelopment of earth in the solar charged material.
In terms of extended analysis beyond the mainstream view of disturbances to GPS, satellite, electronics, in the wake of such an event, in simple terms,expect drama - since the earth itself, weather, biological systems - i.e. natural forces and living beingsare
all bathed in the highly charged electrical soup and therefore
vulnerable to effects. Increased seismic-volcanic activity expected.
Weather more disturbed. Prior events of energetic storming on earth show
a spike in inflamed, explosive, combustible energies -reflected in
fires, bombs, military responses, more news with crimes based on anger,
aggression, violence; animals attacking humans; strongly collective or hive-mind activity such as in mass protests and market behaviour.
[ updated graphs as above will be added when released]
March 17 2013
A geomagnetic sudden impulse was recorded in the earth environment on this day, recorded as a strong impact & occurring 2 days after a full halo coronal mass ejection left the sun following the extended eruption of a magnetic filament. Watch and see any flow on effects from this heightened activity.
March 5 2013
A leap in markets - with Dow jones at a new all-time high of 14,259 -report .
This may reflect in terms of solar activity factors, such an unusually long lull in perturbing factors. But interestingly, the sun on the same day, March 5 produced an M1 flare on the earth facing side but also a massive CME on the far side.
In terms of positioning, Earth is in the next orbital ring beyond Venus but it is currently on March 5 2013 in the region of the left horizonal arrow & out of view, more clearly shown in this March 5 Fourmilabgraphic [ circle with inner cross = earth]
Let's see if there's a sudden reversal of fortunes in coming days as the solar wind hits earth as projected by this graphic [ full animation at source site - note: will expire ]
Click to enlarge & see how green earth dot is in the swirl on & around March 9
Jittery markets ( Italy, Asia, US) but no massive slump as Italy fails to get a clear election result.
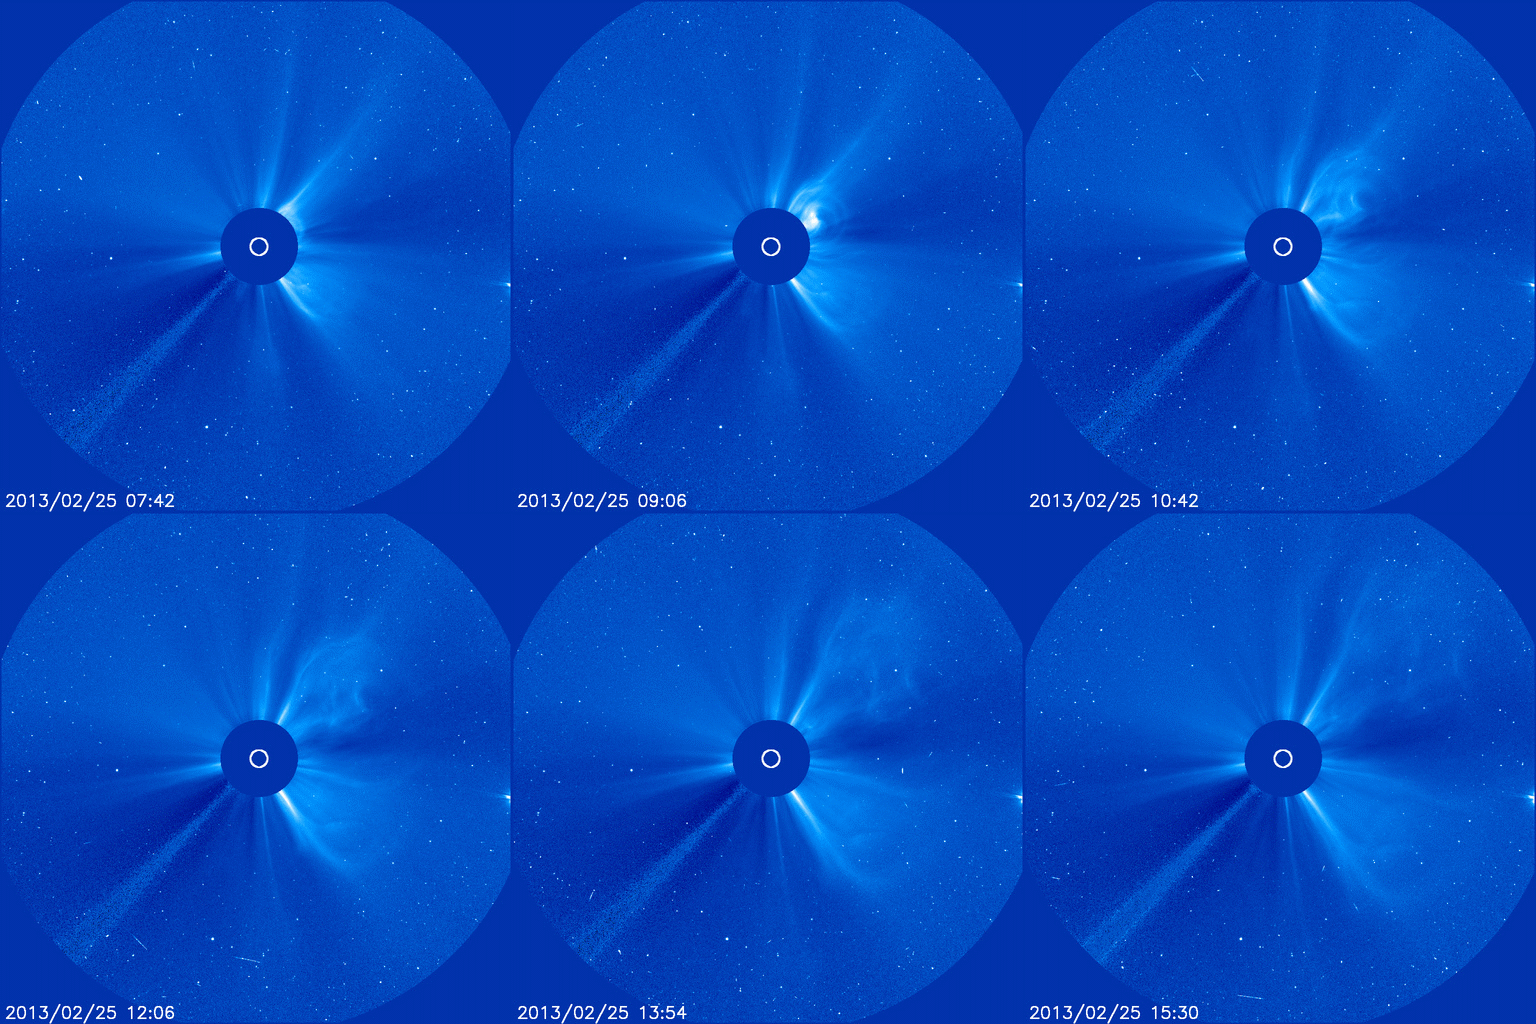
Solar activity remains low in past several months, in terms of flare activity but the question remains re other solar output -such as the Coronal Mass Ejection of February 25 2013 - seen in this video.CME. Since it occurred on the sun's far side the traditional view is No Earth Impact but keeping an open mind may prove more useful..This broader space view -an animated modelsuggests earth is way off range, but science continues to discover prior unknown aspects of astrophysics - with the most subtle likely to be the last uncovered.
July 1 2012
By the end of June sunspot 1513 has delivered 3 M flares since June 28. In addition, a large coronal hole and significant prominence are indicating a sudden uptick in potentially geo-effective solar activity. Earth's magnetic readings have risen on June 30 UT:
June 24 2012
The unusually sluggish patterns of solar cycle 24 continue - with less happening rather than more - as we head to sunspot maximum in 2013, this cycle is looking like other historic lows -refer tosolen graph.
Less spots, less, flares, are only part of the picture though, as the sun can produce filaments of magnetism with associated CMEs and large coronal holes emit powerful high speed wind which has geoeffective potential when earth facing and plugged in to our planet when a southward polarity of the Interplanetary Magnetic Field prevails for an extended period. It's a watch period from now until maximum around May 2013 to see just how much spark the sun will deliver to us in this phase of the cycle before the next decline.
June 16 2012
Spaceweather sources report that only a weak interplanetary shock wave impacted earth at 09:00 UT with no geostorming.
June 15 2012
A second long duration CME out of sunspot 1504 reinforces the potency of this large, currently earth facing, magnetic crucible. A M1.9 flare occurred as the precursor to the CME, on June 14 at 14.36 UT.
The close proximity to the prior CME out of spot 1504 on June 13 ( M1.2 flare) means the high speed solar wind has combined. The 2nd CME sent wind at 1360km/sec according to spaceweather.com.
If the IMF tips persistently south when the combined wind arrives around June 16, then strong geostorming will result with subsequent potential disturbance to any natural & man-made systems.
On June 18 the moon is in maximum north declination relative to thje earth. On June 20 there is a New Moon. These extra geophysical stress factors may synergistically combine with effects from the highly charged earth radiation belts once the solar wind reaches earth
June 14 2012 Mainly a quiet phase involving low level C flares and sporadic M flares with few geo-effective indicators on the usual indices. Only June 11-12 saw 6 hrs of level 5 readings on the Kp index -meaning May and June so far have been underwhelming. Even with recent large coronal holes and high speed solar wind there has rarely been much observed plug-in to earth in the past 6 weeks. Low level M flares occurred on June 6, June 9, June 13 & it is difficult to conclusively say what effect any of these could be having other than adding general turbulence. A significant X flare with geoeffective CME or large coronal hole with earth-facing high speed wind is awaited for comparison in terms of global flow on disturbance.
June 4 2012 Solar activity wakes up as the Dow plunges
The earth based readings reflect recent prior solar activity
a 3.3 M-flare on June 3 UT will add to effects of a high speed solar wind stream heading for earth ETA June4-6.
Coronal Hole CH520 is large and earth facing - sending charged wind in earth's direction This increased activity coincides with a lunar eclipse supermoon [ = close perigee] in maximum south declination, enhancing solar-lunar potentials in geoeffective events. (June 2012 eclipse)
May 31 2012
Ongoing very low solar activity is being noted.
May 17 2012
Sunspot 1476 underwhelmed solar watchers until a long duration M5.1 flare today - right at the edge of rotation
The sudden vertical spike at around 01.30 hrs UT with subsequent CME, causing a radiation storm of solar protons around earth. Speeds exceeded 1500km/sec. There was also a far-side [ back of sun] CME also today, around 1600 hrs UT - see the red trace rise there.
This solar activity is coinciding with worsening economic news. For a full forecast see May 2012 lunar & eclipse post. It's important.
May 9 2012
Market declines have coincided not only with the election of Francois Hollande in France & the Greek crisis, but also with an uptick in solar activity related to a large coronal hole high speedstream and the magnetic fireworks related to massive sunspot 1476 this week. Things could get very interesting if the readings below shoot to the X category on the right hand scale in the next 7 or so days. Watch the markets in the further 10-14 days ahead
The peaks in the red trace represent several higher intensity flares from earth-facing sunspots from May 7-10 2012.
solar disc late May 8 2012 - red coronal holes and spot 1476 very clear.
Recent readings compiled by NOAA SWPC from various northern hemisphere locations plus the estimated planetary readings compared:
This phase could have more steam left in it if sunspot 1465 erupts Worth watching to see if any market effects ensue April 24 [UT] 2012 The last significant geoeffective activated phase was on April 13.
Ten days later the sun has sent material in earth's direction, which has "plugged in" effectively in the time from 03:25 UT on April 23 to present 03:10 UT on April 24
News is in of a world share/stock market drop - report
Geomagnetic data up to end of day April 23 2012 shows the progression to red-bar storm level disturbance. The first 3 hours of April 24 UT have seen the level reach K6 -
April 15 2012 Watching solar activity in case of an upsurge in flares, CMEs, - this is an ongoing link so material relevant to April 2012 will soon expire, as daily updates on the solen site proceed April 11 2012 Markets have been more down than up in the aftermath of March's sustained solar onslaught against planet earth. Since the start of April, little geomagnetic interference from solar output. BBC today:
March 30 2012 Nothing dramatic market wise but theRussian situation has been a bit shaky March 23 2012 This has been an interesting solar flare-CME-High Speed Solar Stream combo period, with the last M flare on March 17. The extended onslaught clearly churned up the geomagnetic field as evidenced by the strong spate of auroras. In Norway by March 22, March had aurora on 18 nights. By March 23 global markets are down, though not a horror show.
NASA analysed
geomagnetically disturbed days on earth over a 75 yr period and they now
consider the spring and fall or autumn equinoxes (equal day-night points)
of March & September to herald the greater frequency of
disturbances and auroras, extending in to April-October: March tops the data, followed by October, April then September.
Feed these four months into a statistical calculation after you read the list of stock market crashes. As a group they feature very highly, with October being particularly prominent - eg 1907, 1929, 1987, 1989, 1992, 1997, 2002. This if course doesn't mean the next big crash will happen in October - a big momentum of solar activity coincided with the August 2011 slump. Best policy is to keep watching the sun as we enter the maximum phase of Cycle 24
March 12 2012
South pointing polarity has occurred quite consistently but the full strength of recent flare events is past.
This list of strongest flares since 2010 ( prior to that was a lengthy lull) gives clear indicators of why August-September 2011 was significant in terms of global markets
August 3-Sept 24 2011 saw a swarm of strong flares ( along with many smaller) Most of these associated with a Coronal Mass Ejection and 6 of the eleven events produced a strong to severe geomagnetic storm (G3-4) This sort of intensity is probably what is required to send the markets into a panic. A summary so far of geomagnetic storms in sunspot Cycle 24: September 2011 stands out having 6 geomagnetic storms in one calendar month - see full data in prior list
March 9 2012
The full potentials of the current solar storm are yet to be realised as the solar field is not fully plugged in to earth. For full effects the solar magnetic field needs to be in negative [south] polarity. For the most part this has not happened. When negative, the field can strongly flow into earth's magnetic environment.
Follow the red trace to see when it dips - and stays persistently - south of the midline - Solar Wind data
At 21.40 UT March 8 this is the screenshot:
March 8
Indicators already apparent regarding the beginning of major geomagnetic effects due to persistent flaring on the sun. Power systems, GPS, satellites and biological systems all vulnerable to disruption / disturbance. Watch from March 7 (UT Universal Time) as the first wave of effects impact earth, what unfolds in global markets as well.
March 7 2012 (NZT) A flurry of flares continues including now an X5.4 off of sunspot 1429 bringing the most consistent flare delivery for some considerable time & more expected. As anticipated there has already been significant market dip news -this from the US
Today 4.58 pm local time the first X flare for 2012 (X1.1) The most recent prior X flare was in Nov 2011 - X1.9 Lets see if the geoeffective consequences are significant enough to disturb human behaviour - and the financial markets
Feb 24 2012
Solar activity has been remarkably subdued with flatlining occurring on the X-Ray graphs fromGOES.
Very little geoeffective activity and no significant global market news.
The largest flare in 2012 so far was on Jan 23 = M8.7 = almost an X
Feb 2 2012
No significant news from the global sharemarkets and the sun has had moderate geoeffective output.
Recap: Jan 14 saw first M flare (M1.0) for 2012; Jan 23 saw largest flare (M8.7). We have not seen an X flare for months. Also refer to data provided by SolarHam
Jan17 2012
Since last report, just two low level M class flares - latest Jan 17, M1.0
No geomagnetic storms for some time
Jan 4 2012
Since New Year 2012, geo-effective solar activity has declined back gradually to B class level. Stockmarkets generally & those in US, China have opened positively.
Dec 30
As anticipated, an M class flare from sunspot 1389 on Dec 29 UT amidst a flurry of C flares. then just in, a second M flare as pictured below. More expected. So far nothing has impacted the geomagnetic field. US market is up.
This pattern is a big change from recent flatlining of the orange band along the base, and the red band equally dormant in the B class
Magnetic Readings on earth have yet to reach Red(Storm) level Website
Dec 29
Sustained C class flares on Dec 27, 28. Markets are now down but no significant slump is expected until flares return to sustained M class or especially X class, with resultant geoeffective turbulence. Charged solar wind from a large solar coronal hole is about to reach earth at year's end. The solar wind's magnetic field (Bz component) is currently in North polarity at 0hr UT - which is not the most geoeffective. Incoming solar material disturbs earth most when the Bz is South.
Sunspot group 1389 promises bigger flare /CME action.
Dec 27 Now three M class flares since Xmas Day 2011
Now two M flares - may precede a bigger X flare.
A smaller M1.5 flare on Dec 26 hot on the heels of:
The largest flare for weeks: M4.0 at 18.16 Universal Time on Christmas Day, coinciding with a complex of solar-lunar-other planetary tensions. Has sent an earth directed CME, incoming around Dec 28 UTC. May not be strong enough to scare the markets!
Dec 13 Watch Dec 18-19 to see if there's geo-effective space turbulence affecting the markets as there's certainly "economic dampner" "financial drain" "money worries" planetary influences on those days. Dec 7-Dec 13 2011 Still no significant geoeffective activity to report, during this unexpectedly lingering phase of relative quiet on the sun. The spots keep coming and they keep promising/threatening, but then they degrade. After this phase, the pattern breaker when it comes could be significant in terms of upsetting the current very fragile equilibrium in the global markets. Meanwhile here's an easy to followexplanation of earth directed solar material There is an imminent eclipse in the wings - total lunar visible in the southern hemisphere coinciding with the moon at maximum north declination in respect of the earth. These factors can trigger turbulence. Exactitude is Dec 10 though the building phase & aftermath phase makes for a period of Dec 7-13 to watch. Also take note of the December solstice when the Sun is at zero degrees of the cardinal sign Capricorn and therefore one of the traditional four seasonal markers. This year the Moon is perigee (closest orb for the month) on Dec 22. Solstice is also on Dec 22. Moon is maximum south on Dec 23 and the New Moon is on the 24th. So this is a whole bunch of factors all compressing into a brief time frame. One source I follow is suggesting there will be enough strain generated to have significant impact on the tectonic state of the planet with significant seismic consequences. Watch and see if the sun gets more active and human behaviour in general and market activity are perturbed by the highly charged atmosphere.
Nov 28 Flares remain low level but the sun is not quiet. Geomagnetic storming is anticipated today: spaceweather.com says: A solar radiation storm is in progress around Earth. At the moment, the storm is classified as minor, which means it has little effect on our planet other than to disturb HF radio transmissions at high latitudes. Bigger effects, however, may be in the offing. The same explosion on Nov. 26th that caused the radiation storm also hurled a CME into space at about 930 km/s (2 million mph). According to analysts at the Goddard Space Weather Lab, the CME will reach Earth on Nov. 28th at17:21 UT (+/- 7 hours).
In adddition after an extended period of no coronal holes, solar wind from a current hole is expected on Nov 29 which may be evidenced by geophysical turbulence.
Nov 24 - Only C class activity since the last update, but on Tuesday 22 (Universal Time) three CME's were emitted from the far side of the sun. As not perceived as earth-directed, mainstream science says irrelevant to earth. But last time I looked there was no wall or fences stopping perturbations spreading across space and having some earth impact. Between 23-26 Nov there is perigee moon, new moon partial solar eclipse and moon at max south declination = 3 strong gravational or tidal synergies in a brief time span, so space weather impacts on earth weather and human responses are anticipated. in this time frameup to next week in particular. Nov 16 - Levels picking up hovering under/over M-class levels - NOAA graphic:
Nov 13 The geomagnetic response to the CME was low but solar watchers are focussed on a giant plasma filament - full report Nov 12 C5 level flare spikes on the 11th but nothing breaching the M class range. A CME is incoming and expected to produce a moderate geomagnetic storm
Nov 11 NOAA saysAn increase to quiet to unsettled levels is expected on day 2 (11 November) as the effects of a CME, from 08 November, are forecast. An increase to unsettled to active conditions on day 3 (12 November) is expected, as the CME, associated with today's M1 flare, is expected to become geoeffective.(CME =coronal mass ejection of charged material from the sun)
Nov 10 Flare activity on Nov 9 up to M class level after a lull period, has coincided with the Dow dropping 388 points - MARKET REPORT
This NOAA proton graph shows the decline
and from Solar Ham: A moderate Solar Flare reaching M1.1 took place at 13:35 UTC Wednesday morning around Sunspot 1342 which is located in the northeast quadrant. It now looks like a Coronal Mass Ejection (CME) resulted and a portion of it may be Earth Directed.
Bear in mind that energetic protons can reach earth as quickly as 30 mins after the peak of a major flare.
Nov 8
The recent solar flare activity was not sufficiently earth-directed to create a geomagnetic storm and resulting energetic turbulence. X-ray flux has declined since the graph below and no further M flares have occurred up to late Monday Universal Time (UTC) but watchers expect more from sunspot group 1339. Markets too are in a holding pattern.
click to enlarge NOAA GOES X-Ray flux graph
After an X-flare in recent days, several M flares have occurred.
Sunspot 1339 is a large grouping & is under observation.
November 6
November 2011 has begun strongly in terms of reinvigorated solar output after a quiet October with no X flares. This week could offer a big burst of activity, so lets see how the global markets & mass behaviour are responding.
The premise outlined in my original, lost document, was whether high solar output has an effect on global sharemarkets and other mass behaviour -since both involve, in effect, a group mind phenomenon, which could be "spooked" by strong electromagnetic impulses -as when the earth receives a strong feed of protons, electrons as a result of solar activity.