An extensive updates section precedes the original 2011 post

 |
| The Bigger Picture - the plate boundary is just the centre of a broad seismically sensitive zone extending into the Pacific seafloor. Place your index finger parallel to either side of the red boundary line to see the extent of the sensitive zone across the visible land of New Zealand and how this equates to the most significant quakes on record. Maps via GNS & USGS |
 | |||||||
| Pegasus Town and the bay that shares its name |
For this reason warnings have been given.
The potential for further significant long-term seismic disturbance is considered highly likely.
In addition, the impact upon personal health rates very highly as a reason to assess the viability of remaining in this location
Complex security issues have arisen in Christchurch that relate not only to earthquake damage and the impacts mentally, emotionally and physically on people, but also security loss due to transformed neighbourhoods and suburbs, living amongst abandoned houses and buildings, all compounded by the stress of financial insecurity and loss of assets.
This blog accumulates information from a variety of sources - from alternative forecasters to mainstream scientists so you can decide what opinions and beliefs make the most sense.
Now, more than ever, people need to do the research and reading in order to fill the gaps left by authorities and their carefully presented media releases.
Government agencies will never release the full story relating to matters of national crisis if they can possibly avoid doing so.
In any extreme public state of emergency there will never be adequate support to rescue the majority of people who need help.
Each of us needs to perform a personal, family and local risk assessment and plan for potential activation if an environmental threat arises.
For many this will result in a plan to relocate away from higher risk locations.
Read on if you need to assess more information related to Christchurch, New Zealand.
November 2016
Extensively detailed landslide map shows full magnitude of Kaikoura quakes

Whaler's Bay Kaikoura now features significant unidentified gas [likely carbon dioxide + hydrogen sulphide] release from cracks in the seabed
Significant aftershocks continue a week after the initial quakes - including a M5.7 on 22 November near Culverden, described as severe and felt widely in Christchurch, causing impact damage in the larger region
At least 6 fault ruptures initially identified


The major Pacific-Australian plate has direct significance to twin quakes that were unleashed just minutes into the morning on November 14 - with perfect synchronicity to the largest i.e. closest moon transit of Earth in 2016 [Supermoon Full moon]
Seismologists are yet to release full specifics of what was initially thought to be a single M7.5 in the north Canterbury rural region of 5 km south-south-west of Waiau, Canterbury

 Just some of the initially registered seismicity from Culverden to Kaikoura and into the seafloor of Pegasus Bay -
data and images from Quakemap
Fatalities reported at very low level [2] the somewhat isolated and rural region has suffered extensive land/infrastructure effects
 Nov 14: Highly vulnerable transit infrastructure covered in a landslip blocks usual route from northern ports at Picton to the eastern centres of the South Island


Nov 14: Another no-go zone in the region of Kaikoura
Although this was not a major tsunami event some activity occurred.
The events related closely to this recent dream:

February 2016
February 2016 has shown repeated seismic unrest in Christchurch
Feb 29 A widely felt, shallow and centrally located M4.3 quake at 3.30 am has intensified the sense of anxiety re the seismic risk in Christchurch.
Despite shaking described as extreme, no initial injury or damage reports notified.
the epicentre in Cashmere

the energy spike that bucks the decay pattern
Feb 17 In a broader context of widespread cuts across the heath sector, including mental health support, hundreds of Christchurch children have been assessed as suffering from post traumatic stress disorder in respect of the ongoing earhquakes since September 2010 but only 8% have received counselling. A university study of a sample of 320 children tracked since 2013 showed 64% had negative mental health indicators -report
Feb 14
The Valentine's Day M5.7 quake on Feb 14 will be easily remembered because many would have thought the trauma would not resume.
Extensively detailed landslide map shows full magnitude of Kaikoura quakes

Whaler's Bay Kaikoura now features significant unidentified gas [likely carbon dioxide + hydrogen sulphide] release from cracks in the seabed
Significant aftershocks continue a week after the initial quakes - including a M5.7 on 22 November near Culverden, described as severe and felt widely in Christchurch, causing impact damage in the larger region
At least 6 fault ruptures initially identified


The major Pacific-Australian plate has direct significance to twin quakes that were unleashed just minutes into the morning on November 14 - with perfect synchronicity to the largest i.e. closest moon transit of Earth in 2016 [Supermoon Full moon]
Seismologists are yet to release full specifics of what was initially thought to be a single M7.5 in the north Canterbury rural region of 5 km south-south-west of Waiau, Canterbury
Despite the widespread knowledge of tidal bulges under an ordinary lunar event, mainstream thinkers range from anger to arrogance in their dismissal of any possible role played by solar-lunar forces.


data and images from Quakemap
Fatalities reported at very low level [2] the somewhat isolated and rural region has suffered extensive land/infrastructure effects


Nov 14: Another no-go zone in the region of Kaikoura
Although this was not a major tsunami event some activity occurred.
The events related closely to this recent dream:

February 2016
February 2016 has shown repeated seismic unrest in Christchurch
Feb 29 A widely felt, shallow and centrally located M4.3 quake at 3.30 am has intensified the sense of anxiety re the seismic risk in Christchurch.
Despite shaking described as extreme, no initial injury or damage reports notified.
 |
| reports from Geonet |

 |
| from Quakelive |
 |
| from Quakemap |
 |
| geonet quake drum with M4.3 & lesser quakes |
Feb 17 In a broader context of widespread cuts across the heath sector, including mental health support, hundreds of Christchurch children have been assessed as suffering from post traumatic stress disorder in respect of the ongoing earhquakes since September 2010 but only 8% have received counselling. A university study of a sample of 320 children tracked since 2013 showed 64% had negative mental health indicators -report
Feb 14
The Valentine's Day M5.7 quake on Feb 14 will be easily remembered because many would have thought the trauma would not resume.
 |
| the big thick trace of the M.7 on Geonet drums |
The psychological impact has far more significance than the moderate level of structural or material damage caused by the 1.13pm event & its aftershocks.
The return of liquefaction, the return of fear, anxiety and expectation.
This seemingly out of the blue large event is consistent with the 50% chance in the M5.0-M5.9 range forecast by scientists less than 6 months ago.
The risk percentage has now been elevated to 63% in the coming 12 months
The risk percentage has now been elevated to 63% in the coming 12 months

The off shore location -some 8kms from land and 15.5kms deep is in the seabed zone regarded in this blog as the most likely source of further significant quakes.
The collapse of a cliif into the sea at Taylor's Mistake, southeast of Sumner was highly visible as tweeted:

Scanning the archived material in this post shows that the seafloor events are capable of producing strong seismic energy - even from lesser magnitudes than M5.
This event in Oct 2013 was M4.6 at 5.5kms deep and around 4kms offshore, north of an indicated fault vs Feb 14 2016 being 4kms further east, deeper and stronger.

November 2015
A report published in September 2015 states that in the aftershock zone of the quake events of 2010-2011 that quake activity remains by September 2015 at nearly 10 times the level of seismic activity prior to those major events - report
In September 2015 there remained a 50% chance of a M5.0-M5.9 in the region.
The message remains: Be Prepared
May 2015
GNS Science published report places even higher emphasis on the megathrust risk in central NZ
 The braided [known] faults in the map below indicate the seismic threads embedded in the upper South Island and seafloor.
Resumed quake activity in 2015 in the Seddon region/Cook Strait and a significant M6.2 shake near St Arnaud on April 24 add to the seismic unrest with potential impact on the Canterbury region
April 20
 81 quakes on this map, most events under M3 in April 2015
Activity in the hills surrounding Lyttelton Harbour on April 7

April 7 M3.8 shakes the city
In September 2015 there remained a 50% chance of a M5.0-M5.9 in the region.
The message remains: Be Prepared
May 2015
GNS Science published report places even higher emphasis on the megathrust risk in central NZ

Resumed quake activity in 2015 in the Seddon region/Cook Strait and a significant M6.2 shake near St Arnaud on April 24 add to the seismic unrest with potential impact on the Canterbury region
April 20
Activity in the hills surrounding Lyttelton Harbour on April 7
April 7 M3.8 shakes the city
The last event of similar size relevant to Chch was on Dec 24 2014.
Though some scoff at planetary conditions that relate to quakes, it is noted that a total Full Moon lunar eclipse occurred less than 24hrs prior to this seismic unrest, adding to a prevailing [2012-2016] higher-than-usual terrestrial strain - on account of Uranus at 90 degrees to Pluto
January 2015 has begun with a reported M6.4 in the central South Island, plus aftershocks from early on January 6
Geonet -Revised report
Located in the sensitive seismic zone close to the Greendale Fault of 2010, this will have seismologists attention.
A M5+ aftershock is possible and with January being a hi-risk month for global seismic activity [read Uranus report] this is not a random event.
including recurrent spikes.
Non damaging events were the norm
Quakelive graphic shows the spread from Sept 2010-Jan 2015
The energy of the M6.4 of Jan 2015 is in the same category as events of 2011

May 2014
The pattern of intermittent stronger quakes continues in a context of less activity but it is apparent for many that the extended aftermath of the quakes is far worse than their immediate effects
From cracks,collapses, liquefaction, dust and subsidence to mould, damp,disease, bitter cold, repeated flooding, post traumatic stress disorder, insurance nightmares, battles with bureaucracy, asbestos threats...and more...the reality of trying to re-establish life in a shattered city.
If you have not already viewed The Shock Doctrine on post-disaster responses [failures] by governments scroll down to the entry from a year ago May 31 2013
April 2014
April 13
Enhanced global seismicity noted in the building phase of the full moon lunar eclipse [exact on Tues 15th -and with extra complexities -Read 2014 extreme events forecast ]
Christchurch experienced a M4.2 -5kms deep at 8.36am near the Port Hills
March 20 saw a M4.04 west in the Greendale fault zone.
M4.74 is presently the pass mark to get into the top 100 for the region
April so far continues the pattern of intermittent events M4+ in a more active recent period but the month has further intense potentials.
This day also saw a major quake in the Solomons Region M7.6 and Christchurch does seem to have echo events when other distant big events occur.

March 5
The recently flooded areas of Christchurch cover an extensive area due to coastal proximity,the river network within suburbs and runoff from nearby hills. These natural factors exacerbate the altered terrain subsequent to the seismic activity since September 2010
The storm system arrived in the New Moon phase when tides came to high monthly values. From Feb 26 Lyttelton tides at 2.4m rose steadily daily, peaking from New Moon on March 1, sustained at 2.6m on March 2 & 3, with declines to 2.5 on March 4 & 5.
This lunar factor provided an extra contribution to the flooding generated by sustained rainfall.
It is unlikely any local authority could cope with the demands of such widespread water threat.
some of the most noted flooded areas included a band of suburbs from St Albans to Mairehau,Shirley & Avonside & New Brighton on the coast
Proximity to the Avon & Heathcote rivers as well as associated creeks was another risk factor due to banks being breached
Avondale, Woolston, Lytellton, Linwood, Woodham, Opawa, Governors Bay also noted.
This is not a complete list.
Flood levels were said to reach 1m in places, even waist high for a man in Mairehau, Cars floated adrift.
The Te Ara flood map is based on longstanding natural conditions:

clearly seismic & extreme weather events combined add considerable extra threats, reaffirming the conclusion that the environment poses unbeatable challenges for many.
In 2014 so far, the seismic pattern continues to show intermittent events of late M3 & over M4 amidst ongoing events generally under M3
The energy chart from Quakelive over the past year does show somewhat of a holding pattern -in that no dramatic upsurge or decline is evident:
 |
| March 2013-March 2014 |
On this basis it could be expected that the region is not yet past the point of further significant seismic movement.
The severe gales and heavy rainfall hitting the region on March 4-5, when the jetstream [pink wind stream] squashed the large circular low pressure system into the coast

have led to scenes of devastation with different flavours than typical of the quake events -very significant flooding and wind damage, but the message continues to be clear:
The city is known to have sunk -with 50cms or half a metre being quoted.
This "basin" effect is of considerable significance in impacting the assets of those still awaiting rebuilds or even those completed in low lying areas.
This is a no-win situation.

Nature is in control of Christchurch and no amount of effort by local or national authorities will mitigate or prevent the sustained ongoing challenges the city faces.
December 2013
A flurry occurred across the region on Dec 19 in the period 12.44am-1.15 am to a maximum of M3.9 - though this was a seafloor event off Parklands & not newsworthy it seems.
This occurred in the context of a pattern over recent months involving lull periods interspersed with sudden activity around M4
December has overall so far been less active than recent months
November 2013
Just when you think it's all over:

Unusual aspects uncovered in Canterbury quake report
An unusually thick and dense rock slab underlies Canterbury - extending in solid form to a depth of some 30kms -whereas a hot plasticity is normal for rock material at 10kms deep. The crustal layer was severely weakened from widespread cracking in the greywacke rock. This local quirk of nature enables much stronger and more widespread seismic effects.
More research will investigate how extensive this density of rock is prevalent in the lower South Island
reportJust when you think it's all over:
Over the year from Nov 2012 to mid Nov 2013
This Quakelive graphic shows an interesting new pattern as of July 29: one of greater extremes in an almost regular sequence of events between the green line M4 up to virtually M4.8 interspersing periods of little to nil recorded activity

 |
| November 18 M4.6 -via Quakelive |
Monday 18 Nov 11.36pm M4.6 in suburban Christchurch, 137 tonnes, being the largest event in the region since October 1st 2013 M4.7 - a seafloor event off New Brighton
October has ended with a bang after an unusual lull period lasting some 20 days
M4.2 at the eastern end zone of the Greendale Fault at 4.21 am followed by a nearby M3.3
The 4.2 is the top quake in the region over the month of October.
Then at 9.45 am a M3.8 50kms n/e of Mt Cook - in range of the Alpine Fault
This activity comes in the wake of extensive high activity on the sun during October particularly in the last week - multiple M and X level flares - high level magnetic discharges which have been shown to precede noticeable seismic responses on earth.
This is where Quakelive puts most of the October 2013 quakes
 |
| a scattergun spread across the region - plus a few more further out West |
After quite sustained lulls this year -e.g. March 23-June 23 2013, a pattern of higher intensity events has prevailed from late June & strengthened from October :
 |
| big spaces in the period late June to early October 2013 showing fewer periods with no activity |
October 2013 week 1 shows more intense seismicity in Canterbury e.g. Oct 1st M4.6 seafloor off New Brighton, and 2 shallow events at M3.3 on subsequent days one east one west.
M4.6 seafloor off New Brighton

Also read October 2013 astro-analysis for relevant background material to this larger than usual lately event
September 30 2013
GNS Science releases revised tsunami risk map for NZ coastlines, based on local or distant quake events, placing the eastern coast of Christchurch at risk of some of the highest levels of inundation facing the South Island - up to 12 metres vs the last assessment of a 10m maximum.
Across NZ, the plate boundary zones are noticeably, but not exclusively, most vulnerable.

 |
| NZ junction of 2 tectonic plates -faults show strong pressure zones |
September 20 2013
sustained activity in the range from M2 to under M3 is the recent norm, but today in the eastern section of the Greendale Fault zone, a M4.1 -showing that sustained potential remains in this sequence -report
September 11 2013With strong atmospheric turbulence evident in diverse locations [Asia, Spain, US, Atlantic, South Is. New Zealand] in the first part of September, reference is made to the advisory contained in my August 2013 report:
updated advisory issued August 26August 31-September 1st there is an emphasis on extreme forces due to the opposition midpoint of Jupiter to Pluto being at right angles to the position of Uranus.
Violent, coercive, dangerous, destructive energies can manifest as aggressive, homicidal acts as well as natural elements with annihilating force.
Under this influence there is heightened likelihood of terrorist and militaristic activity as well as criminal aggression involving the misuse of power.
Natural elements are likely to reveal extreme weather events in various global locations as well as enhanced structural strain resulting in seismic events in vulnerable zones.
This analysis has had extended relevance into September well beyond the point of angular exactitude between Pluto-Jupiter-Uranus - and interestingly, for Canterbury New Zealand the forewarned environmental threat has manifested not as seismic unrest from beneath the ground, [there has been a noticeable lull] but as violent forces from above. As in September 2010 the effects have stuck 2 weeks after the Jupiter-Pluto exact angle.
September 5 2013
Over past 2 months NZ seismicity shown on Geonet maps gives a clear indication that Christchurch/Canterbury region is vulnerable to shallow versus deep-seated quakes.
The currently very active central New Zealand is subject to both deep and shallow.

August 31 2013
Right on target - Canterbury has largest quake in recent weeks as anticipated in earlier forecast made in my August 2013 report. Today's M4.3 in the Greendale fault region which started off the chain in Sept 2010
| from Quakelive |
Large quake events in New Zealand follow the bigger picture of the plate boundary zone - as revealed in the two maps at the top of this page
Geonet statistics over the past year reveal that the larger Canterbury region and the South Island in general are the most seismically active over the period, but the Wellington and Taranaki regions now have prominence in the North Island statistics.
While Christchurch itself has been seismically quieter, activity in the larger region has implications for the local region
Geonet stats.
August 16 2013
This day saw a sudden resumption of high level seismic activity centred in Marlborough, with a M6.6 shake and strong aftershocks. This activity is consistent with the August -High Risk forecast published in June - which indicates further caution is recommended in the latter period of this month. Christchurch/Canterbury may well be registering resonant effects. It is highly relevant to the region that these quakes are occurring due to the relationship to the Alpine Fault
August 12 2013
Quake energy continues on an upward trend coinciding with the seismic unrest in Cook Strait which began on July 19.
The larger region of Canterbury has been subject to ongoing quake activity of moderate strength with intermittent larger events
August 2 2013

New research suggests a large faultline east of the South Island
Stuff report
An uptick is evident in seismic energy output in the Canterbury region in the same time frame as significant quake activity is sustained in the Cook Strait region since July 19
M4.4 Swannanoa area around 4 am on this day
Last 100 quake snapshot from Quakelive shows widespread activity for events M3+ over the past 10 months

A M4.8 event , 9kms deep 20kms n/w of Culverden - south of Hanmer Springs -at 4.37pm confirms a new emphasis in the west and north of Christchurch - with more connection to faults associated with the major Alpine Fault - a specialty subject of Canterbury researcher Tom Robinson -video

July 23 2013
In July the higher quakes over M3 have primarily been in the foothills and high country at the margins of the Southern Alps significantly west of Christchurch. This area of focus extends further the zone of active instability across the region.
NIWA survey ship Tangaroa has been in a section of Pegasus Basin for MBIE survey work. It has now been deployed to the Cook Strait off Marlborough to do echo soundings for undersea landslips since a previously known unstable are needs inspection - report
Though no link is likely to be made by NZ seismologists, the instability of the South Island since Canterbury events beginning September 2010 is being perpetuated by this further trio of sequences in Cook Strait.
July 22 2013
GNS confirm 3 overlapping aftershock sequences in Cook Strait -but contradict an earlier seismologist's statement by saying 'not unusual'.
Large events #1 and #2 were upward thrusts but the largest #3 was a sliding movement
Peak ground acceleration measured in respect of gravity was only 10% of the strength of shaking experienced in the Feb 22 Chch quake. [20%G vs 2G]
Quakemap has removed yesterday's recorded quakes of M4 & M5 for Canterbury but Quakemap retains the latter. These may have been seen as false readings due to the strength of the Cook Strait events.
However both sites initially gave a M4 at 2am on this day - but again no entry on Geonet. The unreliability of the data is becoming a bit too frequent.
Overnight quakes include a M5 in western Haast & several related to the ongoing Cook Strait swarm

update July 21 2013
 | |||
| Geonet quake drum July 21 Wellington NZ records quake activity generated below seafloor, Cook Strait with magnitudes up to M5.8 -exceeding the initial M5.7 event of Friday 19th |
Quakemap
Instead of reducing, the Cook Strait quakes affecting Wellington are increasing with M5.7 on July 19, M5.8 and M6.5 on July 21

 |
| Quakes of this magnitude vibrate through the whole of New Zealand |
 |
| quaklive data |
This snapshot of July 21 shows a M5.2 followed by a M4.3 then M3.7 - forming a triangle from Pegasus Bay to Lowry Hills Range then down to Okuku. Quakelive & Quakemap show this activity -but Geonet appears overloaded & focussing on the main show. This significant activity has arisen in the context of elevated solar-lunar gravitational forces during May-June-July peaking around dates of the Supermoons and likely accumulating with expected further activity in August - see August report
Quakes approaching M4 have been occuring in the larger Canterbury area in the past week -latest July 19 M3.94 , shallow 5kms deep inland hill country near Bealey at 12.13pm.
This follows and most likely a resonant response to the most significant recent quake in NZ earlier, same day, further north: M5.7, 16kms deep, seafloor east of Seddon at 9.06 am.
Multiple aftershocks followed in that location, the highest being M4.5, then 3 between M3.3 - M3.5
Geonet's quake drums show widespread recording of the significant quakes of this day - with vibrations being transmitted over most of the South Island and the lower half of the North Island.

As noted on July 17:
July17 2013
Approaching the Supermoon of July 22 when additional strain will be applied to earth's tectonic structure. This is the 3rd Supermoon - extra close orbit of Moon to Earth in 2013.
Quake energy in the Canterbury region shows an uptick after a lull mid May-mid June
 |
| QUAKELIVE graphic |
June18 2013
Significant flooding from sustained rainfall across Christchurch has added a further level of adversity on top of the enduring hardship and stress from living in compromised housing whilst struggling against obstinate bureaucratic entanglement.
Poor drainage emerges repeatedly as a stymying factor and is likely to be aggravated by liquefaction material gluing up the natural flows.
The settlement of Christchurch was built on the flood plain of the Waimakariri River and so historically, flooding has been an issue.
Now the city faces detrimental effects from the two aspects in combination.
Sample [Google Earth] elevations across the city & surrounds include
North New Brighton 1m above sea levelCentral City, Christchurch - 4m
Woolston - 3m
Mairehau - 8m
Cashmere - 12m
Kaiapoi - 2m
Rolleston - 53m
Most of the residential land in Christchurch is well under 10m above sea level.
The elevation has dropped in many areas at least 20-30cms after seismic movement.
Places near water sources sunk up to one metre.
NIWA says this sinking equates to the effects of 50-100 years of sea level rise
The District Plan requires new buildings in the flood plain to have floor levels 3 metres above sea level but Government guidelines under the Ministry of Business, Innovation and Employment apparently pay little heed to the flood risk.
Occupiers & owners seem to being left at the mercy of the elements and many are at risk of losing their primary asset
Sea level rise is the third element
Inundation from seafloor or further offshore seismicity is the fourth element
Some content sourced from : extensive article in The Press June 1 2013
Refer to: Flood plain map
Refer to : Christchurch Flooding mid June 2013
Refer to: the Addendum in the August 2013 forecast related to planetary factors and possible relevance to Christchurch in August 2013
This June 16 audio from the Insight programme Radio New Zealand discusses the affordability - or not - or further major quake events in New Zealand
June 3 2013
Quakelive shows the latest 100 Canterbury quakes M4+ -the latest on June 1 in Pegasus Bay and the vast majority concentrated undersea
Current affairs programme Campbell Live in New Zealand has consistently proven to be intent on supporting those suffering in the aftermath of the main quake sequences. This Quakelive graphic shows the sustained nature of the shock environment created on a physical level, with almost a year now of similar levels of activity. |
| top right June 1 M4.03 at 20kms depth - via Quakelive |
May 31 2013

What Campbell Live focusses on now is the sustained trauma and suffering experienced by large numbers of Christchurch-Canterbury citizens who are unable to resume life in their accustomed fashion, who are in limbo, on the fringes of the lumbering machine known as EQC - self described as - A New Zealand Government agency providing natural disaster insurance to residential property owners - who are charged with sorting out the claims made subsequent to earthquake-generated damage.
EQC is only part of the full government agency response required to rebuild the city, so a complex fix is required, but from the perspective of those affected, this has been one long, glacially slow road back to any sense of sanity or normality.
Government spokesperson for the quake crisis, Gerry Brownlee has quoted ongoing quakes as the cause of delays, but Quakelive data shows:
- no 2013 quakes in the Top 100 magnitudes since Sept 2010
- M4.74 is at the 100th position
- the last significant events were around a year ago - May & July 2012 M4.88 to M5.23
- Dates keep being put way into the future -2014, 2015 for assessments, rebuilds
Land damage claim assessments only began in January 2013
Land damage assessments expected to take till the end of 2014
September 2015 is announced on May 31 2013 as the first occupancy target for 700 newly built small residences
Many will find the delays torturous and incomprehensible as well as financially ruinous -leading to the situation where the aftermath has become worse than the earthquakes themselves.
The big question is why the government and its local arm, the council would not wish to pour all possible resources into relieving the emotional pressures as speedily as possible.
Sadly the crisis zone of Christchurch reflects other known disaster zones left incomprehensibly long in misery. Think of Haiti after the 2010 quake, New Orleans after the hurricane Japan after the tsunami
An obvious conclusion that stands out is that humanitarian crises are low priority in a world controlled by an elite of extremely wealthy people. This is the rule of plutocracy over sham democracy.
In Christchurch the situation under a plutocratically-led John Key government mimics global crisis zones.
The will to spend what is required to fix Christchurch isn't there - only a pretend version.
The present governing powers are more invested in the crisis continuing - so that the massive investment demanded can be constantly delayed, more people give up and walk away.
The long-term future of the region does involve significant seismic instability either from the Alpine Fault or the eastern seafloor of Pegasus Bay, with everything in the middle under pressure and with this knowledge, investment in Chch may be viewed from many perspectives as a high risk scenario.
For those who want to understand why the agenda of the John Key government would not consider Christchurch a critical priority, an overview of American 20th century economics, spearheaded since the 1960's by figures such as Milton Friedman can be found in the deeply disturbing documentary The Shock Doctrine, based on the book of the same name by Naomi Klein.
Everyone affected by events in Christchurch since September 2010 ought to view this video in order to place their region in the context of other global crisis zones - and the aftermath that the disempowered are forced to endure. The free market, monetarist system has no true intention of helping those weakened by difficult circumstances. This may make you weep.
Please share the Shock Doctrine video as widely as you can and reference Naomi Klein's book
At the most chaotic juncture in Iraq’s civil war, a new law is unveiled that would allow Shell and BP to claim the country’s vast oil reserves…. Immediately following September 11, the Bush Administration quietly out-sources the running of the “War on Terror” to Halliburton and Blackwater…. After a tsunami wipes out the coasts of Southeast Asia, the pristine beaches are auctioned off to tourist resorts.... New Orleans’s residents, scattered from Hurricane Katrina, discover that their public housing, hospitals and schools will never be reopened…. These events are examples of “the shock doctrine”: using the public’s disorientation following massive collective shocks – wars, terrorist attacks, or natural disasters -- to achieve control by imposing economic shock therapy. Sometimes, when the first two shocks don’t succeed in wiping out resistance, a third shock is employed: the electrode in the prison cell or the Taser gun on the streets.
May 2013 events
A pattern of intermittent events over M3.0 and up to M4.2 [see below] - along with sporadic lower magnitude aftershocks continues across the region.
May 2013 has seen the first Supermoon of the year, coinciding with a lunar eclipse on the 25th. This extra strain on geophysical structures has seen large quake events internationally - May 24-25 M6.3 to M8.3 so an increase in local seismicity is not surprising [ May 24-29 three events M3.3 to M3.5 in Canterbury
The next Supermoon [closest perigee or proximity to Earth in 2013] is on June 23
May 17
Today the largest jolt [M4.2 in the region highlighted in the map below - since M3.9 on Feb 22 2013 - news report

Whether coincidental or connected, take note that solar activity was significantly elevated in the period May 13-15 with an exceptional swarm of X flares from one sunspot.
Elevated proton levels are visible in the near earth satellite recordings
 |
| source |
Orange, yellow and green dots show varying depths [5-15kms] with magnitude up to M3.0 [north of Rolleston]
Quakelive's last 100 snapshot:

April 2013
Report on Alpine fault sees Canterbury facing effects equivalent to M7 event -report
The most recent 25 events March 27-April 9 -from M1.9 to M3.0
Coloured dots show variable depths. Though intensity & frequency have declined, recent activity is diverse across the region -north-south-east-west as shown on this clickable graphic from Quakemap

March 2013
Latest aftershock map showing trend from Sept 4 2010 -via GNS Science
 |
| click to enlarge |
just above the extended fingers of the current [pink] sequence lies a known collection of faults in Pegasus Bay.
Zoomed in, an arc through the 4 epicenters shows:

 |
| GNS fault & slippage modelling - details |
The 2 faultline projections above meet opposite New Brighton on the seafloor of Pegasus Bay
Reported March 22 2013: The New Zealand National Institute of Water and Atmospheric Research [NIWA] has been surveying the Kaikoura canyon offshore in Pegasus Bay, to assess tsunami risk from undersea landslides.
Why?
Modelling showed that a submarine landslide at the head of the canyon would cause a significant tsunami that would arrive in South Bay with very little warning, with the crest of the wave about 13 metres above sea level
"This is the most dynamic and active submarine canyon on the New Zealand margin, coming to within 500 metres of the shoreline and dropping to 1000 metres deep within 5 kilometres of the shoreline. Kaikoura is a very active seismic region and with the potential for large earthquakes, any unstable sediment could collapse during a good shake and generate a tsunami. We need to know just what the hazard is from such events to ensure the resilience of coastal communities." says NIWA Marine Geologist Dr Joshu Mountjoy.
-NIWA report
July 2012: After July 6 there has been a tendency towards more quakes on land - versus in the previously dominant Pegasus Bay eastern seafloor locations. The current sequence remains vigorous and has become the longest so far of the four compared = 202 days - see data
July 11 2012
July has seen two large but undamaging quakes a M4.88 at Greendale fault zone on July 6 and a M4.94 on July 10 at Tai Tapu. These fall within the 6 month warning period but July remains a vulnerable period re further significant unrest
June 29 2012
It is now just more than exactly six months since the current sequence started - (Dec 23 2011) & this sequence will on July 4 2012 reach the status of the longest sustained sequence, if no further new event occurs before then. As already stated, this time frame of roughly 6 months is anticipated by geoscience forecasting as well as suggested by pattern analysis, to generate a new event
June 15 2012
The second half of June 2012 is the most concerning in terms of potential global geophysical stressors.
The framework for this analysis derives from planetary groupings and alignments as well as solar activity impacting earth's geomagnetic field.
Bearing in mind this array of conditions in effect over a two week time frame, a potential hi-risk time may be theorized - this is not an outright prediction because so much complexity challenges anyone seeking to pinpoint events in advance. Rather the following information presents a highly dynamic combination of factors in effect for New Zealand & South Pacific Islands on June 20 2012.
The same time can be viewed for Auckland NZ
Tight angles and planetary combos at this time of 10.30pm give rise to concern over a large and damaging water event with associated earth movement. Highly dynamic charts such as this, with many interacting factors, are commonly seen in large scale significant events.
What makes a difference in terms of where energies manifest is the local resonance pattern - which is a complex matter to research & considering that we may be in unknown territory in terms of probabilities. All that can be said is that Christchurch has significantly more recent earth disturbances than Auckland - though an out of the blue off-shore event from the east, of large enough capacity, would be of concern to all of the eastern seaboard of New Zealand.
update June 16 The same pattern is evident in equivalent longitude Pacific Islands -Fiji, Tonga, W. Samoa - suggesting potential for a Pacific quake-tsunami - or at the very least, significant flooding [updates: June 18 - USGS note several quakes on June 17 in the Fiji-Tonga seabed plus June 18 M6.4 off Japan -which also has another destructive pattern on June 20 2012;
 update June 19 2am Kermadec Trench M4.8 quake]
 update June 19 - unusual M5.3 quake s/e of Melbourne plus Fiji, Tonga & Vanuatu all have seafloor quakes over M4 - USGS data
As a comparison, view the equivalent time charts for Sydney & London, compared to pattern in NZ at that time

June 13 2012
Today is the one year anniversary of sequence 3, but it is the fourth sequence, since Dec 23 2011 which remains vigorous - see energy map
Recent days have seen two land based quakes over M3.5
June 2 2012
"... a fault starting about Clarence St near the railway line running NE across Hagley Park, crossing St Asaph, Tuam, Litchfield and Cashels Streets, crossing Fitzgerald at about Hereford St continuing NE out to sea for a while, parallel to but slightly north of Pages Rd, all but the last fault right through the CBD have ruptured."
May 31 2012
In an unexpected location compared to recent trends, a strong M4.5 today west of Ashburton, at Mayfield. View location map of the latest 100 [ pattern will alter continually] Canterbury quakes
The Geonet shake reports were widespread. Star = epicentre; Green dot = strongest

May 27 2012
During the final week of May 2012, the quake pattern has resumed a 'left,right & centre" spread, with shakes recorded in the eastern seafloor, central Christchurch region and the western areas around the Greendale fault. see Quakelive data from May 23.
On May 25 a one kilotonne quake at M5.2 in Pegasus Bay, 11kms offshore, 12.5kms deep is sustaining the vigor of this sequence. Quake scientists gave a 76% chance of a M5+ in the year to March 13 2013. This event fell just 2 months into that time frame. This event is 30th in the top 100 and it is very similar in size & location to a shake of this intensity on Jan 7 2012. The Top 5 quakes continue to be:
M7.1, M6.41, M6.34, M6.0, M5.91
Of these, the Dec 23 2011, M6 at South New Brighton is the closest to the sustained activity in Pegasus Bay and serves as the initiator of the current sequence.
The most destructive and fatal is the Feb 22 2011 event in position 3.
In the Top 5 the Feb quake was also the shallowest (5.95kms)
May 20 2012
 click to enlarge source ChchQuakeMap
Earlier report:
May 15 2012
Less than a week after this area was highlighted -see May 9 entry - Pegasus Bay has produced a M4.5 10kms deep and 6.6 kms off New Brighton. This is the largest quake since the January events noted in this post.
May 9 2012
Though a noticeably quiet period in recent weeks, the details of the last 100 Canterbury quakes are of interest, currently focussed in this sector:
 image source Canterbury QuakeLive
Does our government seriously plan to allow housing along this coastline?
April 12 2012
March 18 2012
Definitely an uptick including 2 quakes over M4 - both on/near Banks Peninsula around 1am this morning.
March 17 2012
March 6 2012
One year on since this post was first published, primary activity is centred in Pegasus Bay now, along with ongoing lesser magnitude events in the western Greendale zone. The Canterbury QuakeLive site energy graph shows the vigorous persistence of the sequence since December 23, (M4.57, 10kms deep in Pegasus Bay) though a declining phase is now evident in terms of frequency, the larger quakes are in the bay .
The Top 100 listed by QuakeLive is also visually revealing
February 22 2012
Counsellors in Christchurch note the big surge in demand re stress conditions. The tipping point is said to be quakes over M4.0 - report
February 9 2012
This updated summary shows how extremely unpredictable the seismic activity is in terms of WHERE. The official geoscience view is a tidy progression eastwards, offshore and out of harm's way. That expectation looks good on paper and in powerpoint presentations, but neat and tidy is not nature's way. The reliance on computer modelling is the achilles heel of the "experts" in this extended readjustment of ancient earth.
February 8 2012
Diverse seimic activity continues. Since January 23 2012 the five bigger quakes (over M4.0) have occurred in 3 different zones
January 27 2012
Public were not warned even though the information was available before Feb 22 quake -
Press report
Renewed recent activity at the Greendale fault zone confirms there is more stress to be released here. Vigorous seismic activity in the period Dec 23-Jan 27 is evident on the energy graph at quakelive
Government departments (IRD, WINZ) are known to have signed 9 year leases to operate from the western fringes of Christchurch city and today the rebuild of Christchurch is said to be delayed further on account of reinsurer concern over seismic instability since the Dec 23 2011 sequence unfolded in Pegasus Bay. REPORT
January 18 2012
Across the globe, governments are complicit in allowing people to reside in hazardous zones. The NZ government is no different. Read this recent report from The Economist
January 17 2012
A 2007 paper on the Great alpine Fault down the spine of the South Island. Read this if you want a scientific appraisal related to the seismic outlook for the South Island.
Plus what geoscientists said about the alpine fault on Sept 7 2010 after the Darfield quake
 Pegasus the Winged Horse - image via ThinkQuest
January 13 2012
The focus on Pegasus Bay continues in terms of significant seismic activity, though Jan 12 was notable for diverse small quakes on the mainland from east to west of Canterbury - data
Why?
Modelling showed that a submarine landslide at the head of the canyon would cause a significant tsunami that would arrive in South Bay with very little warning, with the crest of the wave about 13 metres above sea level
"This is the most dynamic and active submarine canyon on the New Zealand margin, coming to within 500 metres of the shoreline and dropping to 1000 metres deep within 5 kilometres of the shoreline. Kaikoura is a very active seismic region and with the potential for large earthquakes, any unstable sediment could collapse during a good shake and generate a tsunami. We need to know just what the hazard is from such events to ensure the resilience of coastal communities." says NIWA Marine Geologist Dr Joshu Mountjoy.
-NIWA report
September 21 2012
Recent event over M4 - Sept 21 M4.3
In recent months, the region had reached the longest period of inactivity/minimal seismicity since the Sept 4 2010 initial sequence. see July-August 2012 data
Seafloor events in Pegasus Bay continue to dominate.
July 2012: After July 6 there has been a tendency towards more quakes on land - versus in the previously dominant Pegasus Bay eastern seafloor locations. The current sequence remains vigorous and has become the longest so far of the four compared = 202 days - see data
July 11 2012
July has seen two large but undamaging quakes a M4.88 at Greendale fault zone on July 6 and a M4.94 on July 10 at Tai Tapu. These fall within the 6 month warning period but July remains a vulnerable period re further significant unrest
June 29 2012
It is now just more than exactly six months since the current sequence started - (Dec 23 2011) & this sequence will on July 4 2012 reach the status of the longest sustained sequence, if no further new event occurs before then. As already stated, this time frame of roughly 6 months is anticipated by geoscience forecasting as well as suggested by pattern analysis, to generate a new event
The final week of June 2012 has seen several events M3.5-M4 in the eastern seafloor
- June 23 seafloor off Parklands
- June 29 seafloor South New Brighton estuary
- June 28 seafloor off Parklands
- June 26 seafloor off North New Brighton
- This is in addition to M3.99 Darfield June 23
- In the regional Pacific quake zone continual activity over M4 is noted by USGS in the region of Tonga, Fiji & the Kermadec Trench in particular, in the time frame in the week from June 22 2012.
Potentials noted on June 15 for NZ & South Pacific have not manifested, though this can indicate deep & powerful processes that are building and as yet undetected. The months ahead will have a generally heightened risk for seismic activity in vulnerable areas, globally, which could include Christchurch.
June 2012 has seen considerable quake activity over M4 globally including unexpected activity including Gippsland, Australia M5.3June 15 2012
The second half of June 2012 is the most concerning in terms of potential global geophysical stressors.
The framework for this analysis derives from planetary groupings and alignments as well as solar activity impacting earth's geomagnetic field.
Factors currently in the mix include:
1. Increased solar activity producing earth-directed high speed wind with geostorming potentials from June 16/17 [Spaceweather sources first reported that only a weak interplanetary shock wave impacted earth at 09:00 UT on June 16 with no geostorming. A spaceweather.com update contradicted this as there was a weak impact followed by a stronger one, perturbing earth's magnetosphere with strong compression & a rise in global magnetic readings on June 17 ]
2. Moon in maximum north declination on June 18
3. New Moon on June 20 at solstice
4. the combined planetary picture at 10.30pm June 20
5. Saturn-Venus on June 21
6. Pluto-Uranus exact over many days
7. Jupiter-Neptune exact over many days
8. Sun-Moon-Pluto-Uranus on June 27
9. Pluto-Sun-Uranus on June 30 Bearing in mind this array of conditions in effect over a two week time frame, a potential hi-risk time may be theorized - this is not an outright prediction because so much complexity challenges anyone seeking to pinpoint events in advance. Rather the following information presents a highly dynamic combination of factors in effect for New Zealand & South Pacific Islands on June 20 2012.
 |
| Event chart: June 20, 2012 Christchurch NZ - click to enlarge |
 | |
| The Auckland chart shows few differences on account of NZ being a narrow country with similar longitude to Christchurch. Auckland 36.85S, 174.78E vs Chch 43.5S, 172.60E |
What makes a difference in terms of where energies manifest is the local resonance pattern - which is a complex matter to research & considering that we may be in unknown territory in terms of probabilities. All that can be said is that Christchurch has significantly more recent earth disturbances than Auckland - though an out of the blue off-shore event from the east, of large enough capacity, would be of concern to all of the eastern seaboard of New Zealand.
update June 16 The same pattern is evident in equivalent longitude Pacific Islands -Fiji, Tonga, W. Samoa - suggesting potential for a Pacific quake-tsunami - or at the very least, significant flooding [updates: June 18 - USGS note several quakes on June 17 in the Fiji-Tonga seabed plus June 18 M6.4 off Japan -which also has another destructive pattern on June 20 2012;


As a comparison, view the equivalent time charts for Sydney & London, compared to pattern in NZ at that time

 |
| The London pattern is flipped, being in the opposite hemisphere, but it is essentially very similar to Sydney's at the equivalent time & both differ from the 2 NZ charts - click to enlarge all graphics |
Today is the one year anniversary of sequence 3, but it is the fourth sequence, since Dec 23 2011 which remains vigorous - see energy map
Recent days have seen two land based quakes over M3.5
June 2 2012
M4.3, 9kms deep this morning, seafloor off Sumner, adding to recent M4+ activity in Pegasus Bay
An anonymous comment on the Press Quake Science page says he requested a faults map off GNS science under the Official Information Act. He was supplied a photo & says there is a CBD fault that is yet to rupture"... a fault starting about Clarence St near the railway line running NE across Hagley Park, crossing St Asaph, Tuam, Litchfield and Cashels Streets, crossing Fitzgerald at about Hereford St continuing NE out to sea for a while, parallel to but slightly north of Pages Rd, all but the last fault right through the CBD have ruptured."
May 31 2012
In an unexpected location compared to recent trends, a strong M4.5 today west of Ashburton, at Mayfield. View location map of the latest 100 [ pattern will alter continually] Canterbury quakes
The Geonet shake reports were widespread. Star = epicentre; Green dot = strongest

May 27 2012
During the final week of May 2012, the quake pattern has resumed a 'left,right & centre" spread, with shakes recorded in the eastern seafloor, central Christchurch region and the western areas around the Greendale fault. see Quakelive data from May 23.
On May 25 a one kilotonne quake at M5.2 in Pegasus Bay, 11kms offshore, 12.5kms deep is sustaining the vigor of this sequence. Quake scientists gave a 76% chance of a M5+ in the year to March 13 2013. This event fell just 2 months into that time frame. This event is 30th in the top 100 and it is very similar in size & location to a shake of this intensity on Jan 7 2012. The Top 5 quakes continue to be:
M7.1, M6.41, M6.34, M6.0, M5.91
Of these, the Dec 23 2011, M6 at South New Brighton is the closest to the sustained activity in Pegasus Bay and serves as the initiator of the current sequence.
The most destructive and fatal is the Feb 22 2011 event in position 3.
In the Top 5 the Feb quake was also the shallowest (5.95kms)
May 20 2012
6.25pm update:
M4.8 seafloor quake, 5.06pm, seafloor off Sumner, 8kms deep. No damage or outages reported.
This represents a vigorous and unusual sequence when compared to the prior the 3 in Christchurch region since Sept 2010, since that first event started with a M7.1 & the current sequence began with M6.0

Earlier report:
The seismicly sensitive Rolleston tip of the Greendale fault has been active this morning, producing a M4.1 quake, 10 kms deep at 9.35 am. The Rolleston area features significantly in the top 100 quakes of Canterbury since Sept 4 2010. The current Top 100 ranges from the initial M7.1 down to M4.63.
Update & correction: The M4.8 has now entered the Top 100 at spot 71.
Top 100 positions 13, 26, 40, 44, 53, 69, 76, 91, 93 (9 events) all occurred in January 2012, so today's quake means 10% of the Top 100 have occurred within the first 6 months of 2012 - data
Noting that this coincides within the effective period of an annular solar eclipse [exact on May 21 NZ time]. This eclipse is heightened in terms of quake risks due to the lunar declination - position relative to earth coming to maximum north position [21 degrees 42 N] on May 22 2012 - see Richard Nolle's Astropro table of declinations for the moon . This maximum position is one of 4 high risk periods for the effects of lunar pull to be heightened ( the others are max south, over equator heading north, and over equator, heading south. Nolle is one of many who consider such factors as eclipses, declinations & various other planetary factors can pose greater stresses on the earth's structure. Astropro forecasts
May 15 2012
Less than a week after this area was highlighted -see May 9 entry - Pegasus Bay has produced a M4.5 10kms deep and 6.6 kms off New Brighton. This is the largest quake since the January events noted in this post.
May 9 2012
Though a noticeably quiet period in recent weeks, the details of the last 100 Canterbury quakes are of interest, currently focussed in this sector:

Does our government seriously plan to allow housing along this coastline?
April 12 2012
12 noon very close after a M7 in Mexico and within 24hrs of a major sequence in the waters off western Indonesia, Pegasus Bay registers a M4.6, the biggest quake since January 2012
March 26 2012
Tsunami risks in the Kaikoura canyon may have implications for coastal Cantabrians. Environment Canterbury has a copy of the report by Canterbury University researcher Jen DuBois. Scientists are considering further exploration of the canyon. 16 prior local tsunamis with impact effects have been noted since European occupation. Southshore residents would be at risk. Depending on tidal factors wave metres would vary in different locations along the extended coastline from Kaikoura to Christchurch - estimates ranging from 2-10metres. The standard view is that a minimum magnitude 7 quake offshore would be required to generate a damaging tsunami and the probability of that occurring in the next year is put at under 1%. Again this is a situation of being informed and then acting on your own conclusions. - read news reportMarch 18 2012
Definitely an uptick including 2 quakes over M4 - both on/near Banks Peninsula around 1am this morning.
Geonet continues to disappoint despite it's suposed rapid response system. More detail can be found at Quakelive including this interesting map of 24hr swarms after the main events
March 17 2012
The past week has been notable for an "all over the place" pattern - moderate events individually, with nothing over M4, but collectively indicative of ongoing widespread movement.
- DATAMarch 6 2012
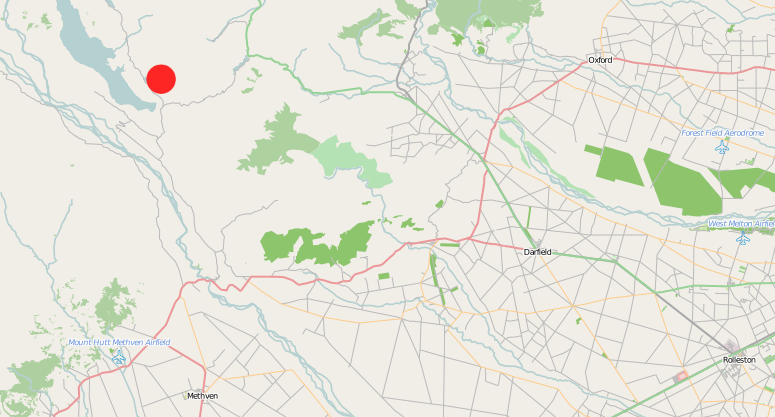
A Pegasus Town development is in the news due to issues over geotech reports. As visible from the Google Map above, this new town is at the mercy of any significant seismic activity generated in the bay. Developers feel they have done adequate land strengthening. That assertion is yet to be significantly tested.
PRESS REPORT One year on since this post was first published, primary activity is centred in Pegasus Bay now, along with ongoing lesser magnitude events in the western Greendale zone. The Canterbury QuakeLive site energy graph shows the vigorous persistence of the sequence since December 23, (M4.57, 10kms deep in Pegasus Bay) though a declining phase is now evident in terms of frequency, the larger quakes are in the bay .
 | |
| QuakLive graph -click to enlarge |
February 22 2012
Counsellors in Christchurch note the big surge in demand re stress conditions. The tipping point is said to be quakes over M4.0 - report
February 9 2012
This updated summary shows how extremely unpredictable the seismic activity is in terms of WHERE. The official geoscience view is a tidy progression eastwards, offshore and out of harm's way. That expectation looks good on paper and in powerpoint presentations, but neat and tidy is not nature's way. The reliance on computer modelling is the achilles heel of the "experts" in this extended readjustment of ancient earth.
 |
| click any graphic to enlarge |
February 8 2012
Diverse seimic activity continues. Since January 23 2012 the five bigger quakes (over M4.0) have occurred in 3 different zones
Jan 23 M4.5 Pegasus Bay
Jan 27 M4.6 Rolleston
Jan 28 M4.2 Pegasus Bay
Feb 8 M4.2 Banks Peninsula
Feb 8 M4.3 Banks PeninsulaJanuary 27 2012
Public were not warned even though the information was available before Feb 22 quake -
Press report
Renewed recent activity at the Greendale fault zone confirms there is more stress to be released here. Vigorous seismic activity in the period Dec 23-Jan 27 is evident on the energy graph at quakelive
Government departments (IRD, WINZ) are known to have signed 9 year leases to operate from the western fringes of Christchurch city and today the rebuild of Christchurch is said to be delayed further on account of reinsurer concern over seismic instability since the Dec 23 2011 sequence unfolded in Pegasus Bay. REPORT
January 18 2012
Across the globe, governments are complicit in allowing people to reside in hazardous zones. The NZ government is no different. Read this recent report from The Economist
January 17 2012
A 2007 paper on the Great alpine Fault down the spine of the South Island. Read this if you want a scientific appraisal related to the seismic outlook for the South Island.
Plus what geoscientists said about the alpine fault on Sept 7 2010 after the Darfield quake

January 13 2012
The focus on Pegasus Bay continues in terms of significant seismic activity, though Jan 12 was notable for diverse small quakes on the mainland from east to west of Canterbury - data
January 12 2012
Christchurch may take decades to recover, says American Professor of Architecture
REPORT
January 10 2012
Dr Kelvin Berryman, GNS Science reported in The Press:
By the end of January a large group including international scientists studying Christchurch expect to deliver an updated model of the seismic situation in Canterbury
"Canterbury was following a more unusual, unpredictable "cluster" pattern..."
"...earthquakes are going to become more part of the fabric of Canterbury..."
FULL REPORT
***********************************************************
Updated entries on Mathematics Link Christchurch Quakes show how powerful the December 23 new Pegasus Bay sequence is. This new sequence may provide a big clue to the next significant phase.
January 9 2012
A 2011 interview in New Scientist - Hamish Campbell from GNS Science calls the rate of plate movement at the alpine fault "colossal" and that
"The activity that is already shredding the country will ultimately see South Island "split in two along the Alpine boundary", says Campbell. The town of Kaikoura would be at the northern tip of one island, with Greymouth at the southern tip of the other, he predicts." This comment is in the context of millions of years, using standard geological modelling, but you could be forgiven for feeling that the plate boundary traversing the South Island is not at all in a sufficiently settled state to give people confidence. -FULL REPORT
January 6 2012
Reports from the seismologists meeting today in Chch downplay any tsunami risk but say aftershocks could continue for decades. Hopefully this forecast alone will be enough to convince scores more citizens of the region to relocate far from this fractured zone and its continually recycled negative energies, which hang around natural disaster areas such as this.
Despite claims of "low probability" a tsunami warning system will be installed within months.
This action is very appropriate - since if you read between the lines, a real and present danger from a seafloor surge can be assumed to have been already factored in - but not as meaningful as condemning the seaside suburbs as beyond acceptable risk.
The present fractures in Pegasus Bay are said to be capable of linking to the larger Kaiapoi fault where a M7 ( the level at which tsunami may be generated) - is possible -full Press report
January 3 2012
REPORT
January 10 2012
Dr Kelvin Berryman, GNS Science reported in The Press:
By the end of January a large group including international scientists studying Christchurch expect to deliver an updated model of the seismic situation in Canterbury
"Canterbury was following a more unusual, unpredictable "cluster" pattern..."
"...earthquakes are going to become more part of the fabric of Canterbury..."
FULL REPORT
***********************************************************
Updated entries on Mathematics Link Christchurch Quakes show how powerful the December 23 new Pegasus Bay sequence is. This new sequence may provide a big clue to the next significant phase.
January 9 2012
A 2011 interview in New Scientist - Hamish Campbell from GNS Science calls the rate of plate movement at the alpine fault "colossal" and that
"The activity that is already shredding the country will ultimately see South Island "split in two along the Alpine boundary", says Campbell. The town of Kaikoura would be at the northern tip of one island, with Greymouth at the southern tip of the other, he predicts." This comment is in the context of millions of years, using standard geological modelling, but you could be forgiven for feeling that the plate boundary traversing the South Island is not at all in a sufficiently settled state to give people confidence. -FULL REPORT
 |
| GNS Science graphic shows South Island's tectonic vulnerability |
January 6 2012
 |
| CLICK TO ENLARGE - GEONET NZ GRAPHIC M5 quake punctuates the meeting held today |
Despite claims of "low probability" a tsunami warning system will be installed within months.
This action is very appropriate - since if you read between the lines, a real and present danger from a seafloor surge can be assumed to have been already factored in - but not as meaningful as condemning the seaside suburbs as beyond acceptable risk.
The present fractures in Pegasus Bay are said to be capable of linking to the larger Kaiapoi fault where a M7 ( the level at which tsunami may be generated) - is possible -full Press report
January 3 2012
With seismologists meeting under urgency later this week, to consider the ongoing seismic threats in Christchurch, they will provide some responses to the public. Residents must demand that government gives maximum support to those who wish to leave Christchurch.
To date, no adequate reassurance has been forthcoming from authorities, because in reality they are dumbfounded by the sequences unfolding. Historic modelling of potentials may grossly underestimate and consider "highly unlikely" the scenarios people fear most - but events in Christchurch since Sept 4 2010 were also in the highly unlikely category. Seismologists and government agencies are conservative in their views - and frankly, in their thinking. I have urged people to leave since Day One in this long sorry saga. That opinion remains. However it is clear many will doggedly and determinedly attempt to maintain their position in defiance of these powerful natural forces. Time will show that no human can bear this type of unrelentless onslaught without major costs to mental, physical and emotional health, amidst the the fuller picture of change and loss.
The mythology of Pegasus is worth exploring -as it was relevant years back to trace the roots of Erebus, for ancient echoes - as names have immense power and are far from insignificant.
In Greek mythology, Pegasus the winged horse was fathered by the sea god Poseidon. He carried thunderbolts for the god Zeus and so is connected to electrical storms. On rocky Mount Helikon, Pegasus stamped his hoof and released a gushing spring, a streaming fountain of water. This water was seen as a purification and cleansing.
From this, I read a very spiritual imperative in the seismic events in Christchurch -that much purification of the energy of the place and people collectively is needed for healing to occur. Storms and water bursting forth are likely both entailed in this process, with the rocky substrate of the seafloor responding to the seismic force of Pegasus pounding his hoof.
From a broader geological point of view, westwards movement of the Pacific plate and uplift of the Australian plate could be showing a stress point in the Christchurch zone of NZ. - more geological information and graphics
The mythology of Pegasus is worth exploring -as it was relevant years back to trace the roots of Erebus, for ancient echoes - as names have immense power and are far from insignificant.
In Greek mythology, Pegasus the winged horse was fathered by the sea god Poseidon. He carried thunderbolts for the god Zeus and so is connected to electrical storms. On rocky Mount Helikon, Pegasus stamped his hoof and released a gushing spring, a streaming fountain of water. This water was seen as a purification and cleansing.
From this, I read a very spiritual imperative in the seismic events in Christchurch -that much purification of the energy of the place and people collectively is needed for healing to occur. Storms and water bursting forth are likely both entailed in this process, with the rocky substrate of the seafloor responding to the seismic force of Pegasus pounding his hoof.
January 2 2012
The major quake sequence in Pegusus Bay continues to pump out kilotonnes of energy.
This activity reaffirms why warnings have been given. The longterm destabilisation of the region of Christchurch must be contemplated as a real and ongoing threat to residents. This situation in the eastern seafloor has much more unfoldment to come. Please make whatever choices you can to relocate out of harm's way.
 |
| GNS science locator map for large events in NZ history |
December 26 2011
After many had assumed by mid December 2011 that a continuing downtrend was creating a new level of stability for the land and people of Christchurch, a new sequence unfolded from December 23 at 1.58pm, primarily resulting in aftershocks in Pegasus Bay -close offshore from New Brighton, bringing renewed flooding, heavy silt from liquefaction and more damage as well as the effects on mental health.
It beggars belief that the government had not already written off the beach-side eastern suburbs as uninhabitable, in view of their high level of vulnerability. The quake sequence since Sept 4 has progressively spread eastwards and convincingly now is pummeling the seafloor of Pegasus Bay at shallow depths.
Note that this sequence unfolded with strong solar-lunar plus other planetary stress factors -dismissed by authorities and conservative scientists. Refer forecasts linked to the planetary analysis published early Dec 2011.
For extended information, data and graphics go to the popular post Christchurch Shakes Again & Again
^^^^^^^^^^^^^^^^^^^^^^^^^^^^^^^^^^^^^^^^^^^
There are notable aspects about the solar-lunar influences upon earth on and around March 20 -meaning people, places, weather, environmental events, things and the structure of the earth itself. The question is whether these circumstances are exceptional enough to cause further seismic or environmental problems and also where such events might happen.^^^^^^^^^^^^^^^^^^^^^^^^^^^^^^^^^^^^^^^^^^^
Original Post from March 2011:
Christchurch
-why warnings have been given
First consider this quote from a Press Release issued Monday, March 14, 2011 8:00 AM by Space and Science Research Corporation, Florida USA:
Dr. Fumio Tsunado and Dr. Dong Choi are highly respected scientists and each have decades of research into seismic activity, especially in the area surrounding Japan. They view the Sendai quake as another signal of the interrelation of the Sun and Moon which respectively exert tidal and geomagnetic forces on the Earth. These forces can bring the strongest quakes to the surface though originating from deep within the Earth. Plate tectonics theory they say, which focuses in part on the movement of upper mantle layers and subduction zones, is not the only causal factor in the largest earthquakes and associated volcanic activity. (source link at end of this blog)
The moon will be extra close, in fact in its closest range to earth for the whole of 2011. This position is reached during a full moon, the sun and moon in exact mathematical alignment, on March 20 (New Zealand time, March 19 Universal Time eg UK).
The influence is a broad brush, not a pin point and the most common highly visible evidence of this is the tides. They don't suddenly leap to a maximum, the influence spreads over several days,

NIWA graphic
 |
| Tide graphic from Marine Weather clearly shows the rise and fall pattern related to a lunar event. This event occurred on May 6 2012, at around 3.30pm when the moon was at closest annual perigee coinciding with full moon = supermoon. The tide rises AFTER exactitude of the lunar factors on the 6th & takes almost exactly 3 days to peak, with a gradual decline over 3 further days. |
and the tides do NOT peak on the Full Moon -the rising energy created by the gravitational pull keeps the tides extra high and low for several days after exact full moon. On the 21st-22nd in New Zealand the tides will be termed King - due to the moon's closest range combined with full moon. The usual high New Moon-Full Moon tides are called spring tides. Note: Christchurch is preparing stopbanks as of 15 March in preparation for tidal flooding
Certain effects, like the tides are seen to manifest after full moon, but others are brought about in the building phase. This is a period of heightened activity covering around a week, so trying to predict when, what and where activity will manifest is certainly a complex business. People like Ken Ring and UK astrophysicist Piers Corbyn focus specifically on weather forecasting, but both are increasingly talking of earthquake prediction. Their methods differ -whether to emphasise this or that, but in a nutshell they are both talking about earth's weather being generated from bodies in space = space-weather, because outer space is a highly turbulent, supercharged environment which impacts upon earth constantly. We're on a planet -not a holiday camp.
So why would Ken Ring be talking so much about March 19-20 ( the exact full moon is 6.11 pm in the UK on 19th, so it will be 7.11am on the 20th in NZ. He feels these astronomical factors have repeated in the time period of recent earthquake events seen in NZ:
"Perigee" means moon closest to earth for the month. We have seen the 4 September 7.1 event (new moon+second closest perigee) of 648 kilotons, followed by 7 October (new moon+perigee#6) which brought (8th) the next biggest event, two 4+ jolts around 6.30am totalling 96 metric tons. The following month, on 4-6 November, new moon in perigee brought on 7th at just before 3am, the next biggest aftershock of 118 tonnes. The next month? Perigee was 26-27 December, as perigeal new moon changed to perigeal full moon. On 26 December came the next biggest jolt since the last, a month ago; a 4.9mag king-hit of 346 tons. With 20 January's full moon+perigee, came the next biggest earthquake to hit Christchurch, a 5.1mag event. - quote from Ken Ring's website
Here is the table showing relevant 2010 perigees with dates for comparison
Perigee is after date and time, on the left column, measured in km


.
To simplify and clarify what Ken Ring points out in reference to the sun, moon and events in Christchurch :
On Sept 4 2010 the New Moon occurred 4 days after the 7.1 initial quake event
In October, the New Moon was followed a day later by 2 significant jolts
In November the New Moon on the 6th, was followed a day later by a significant jolt
In December the Full Moon on the 21st was followed 5 days later by a significant jolt
In January 2011 the Full Moon on the 19th was followed one day later by a significant jolt
In February 2011 the Full Moon on the 18th was followed 4 days later by the major 6.8 quake
All of these events also clustered around the date of the Perigee moon on each month in questionThese links to the solar-lunar cycles, being alignments and positions are seen by Ken Ring as forming a pattern that has repeated each month since September, targeting the Christchurch area in NZ.
The 2011 data (Universal Time) is 13hrs behind local time eg the Jan Full Moon was 20th in NZ:


On this basis Ken Ring feels the Full Moon (March 20th in NZ) again clustering with the Perigee Moon position(March 19) and therefore he says it is likely we will see a continuation of this pattern, which has seen a repeated hammering of the Christchurch area. Even though this is a very small sample of events, the data confirms this position, so far and if a significant jolt, above M5 is to occur, when might that happen? Looking for patterns again, you could consider the prior 3 Full Moon with Perigee clusters. The jolts happened either same day, four days or five days after Full Moon
December January February March
Full Moon 21 20 18 20
Perigee 25 22 19 19Quake 26 20 22
If this pattern holds, as Ken Ring believes, then a significant quake or jolt would be expected to occur in the date range 20 March-24 March, in a similar geographic area of Christchurch.
My position is that it takes more than just these factors to tumble the combination lock, because I believe other planetary forces act in a synergistic fashion to ramp up the energy to a point of overload. Are there any other factors around this date range that could contribute? The events data above shows 2 of the quakes occurred after the full Moon; the January 20 event occurred around 5 hours before full moon and these variations, this lack of a fixed pattern, indicates to me that the extra factor/s bring about the timing.Two possibilities arise in terms of energy surges building around this time, one involves increased risk of flooding in at least the first 3 weeks of March - so that is one form of environmental pressure, the other is an example of space weather: the likelihood of stronger solar electromagnetic activity, which, once it reaches earth, is capable of multiple disruptions to electronics, weather and geophysics. This latter effect is very strong 20th-21st of March and could translate into earth disturbances
Updates: PLEASE continue to check back for more updates during March
March 8 Flooding news from Queensland Australia, Indianapolis, USA ( many other USA examples online).
Global map of earthquake risks surrounding March full moon 2011
Interestingly the Herald on Sunday (March 6 2011) reported on a sudden awareness that came to Australian psychic medium Deb Webber. Having watched Deb's performance on Sensing Murder NZ, and being experienced enough to be able to assess her, I have full faith in her abilities. She told the Herald she doesn't work in the area of predictions but on February 19 in the middle of a reading, she blurted out to her client that a massive earthquake was coming soon (to New Zealand) "and it'll split the country in two". On Feb 22 once the quake occurred, her Facebook message ended with the statement.."I feel this will not be the last of the devastation." Deb Webber says she is not yet sure whether the "devastation" related to another event or was in respect of the Feb 22 event itself. (note Facebook dates are American)

What we do know is that NZ as yet has not "split in two" from a quake. The nation comprises two ostensibly separate, main islands - but a huge land mass lies underneath that supports both islands.
The South Island is however sitting on top of two tectonic plates and their grinding created the Southern Alps.
Her use of the word "massive" is also interesting as M6.3 is not in the mega-range, though the peak ground acceleration recorded at over twice the value of gravity, in the Feb 22 event, has been stated as the highest ever recorded globally, resulting in widespread and catastrophic examples of damage -easily categorized, if seen in a vision, as "massive". So whether this event is the one Deb Webber sensed was coming, and whether a further event is to come affecting Christchurch or even greater New Zealand, many will be anxious to find out.
My personal sense, as soon as the Sept 4 quake occurred in Christchurch, was that people definitely needed to leave the area - and that means for good.
This shocking second event confirmed those feelings and I remain with a heavy heart about the future of Christchurch as a safe place to live.. Listen to your gut instinct - and pay attention to your dreams.
If you are in Christchurch and feel an urgent need to leave, DO.
With the March 11 devastation in Japan, the question re the vulnerability of Christchurch becomes even more critical. You will hear geologists say "there is no connection". Their view, at the very least, is lacking in holistic concepts. Planet earth is a body in the same way that each distinct human or species is a body. To say one major event in one location has no connection to the rest of the body is extremely simplistic thinking and is not shared by many in the international geoscience community. This period is hazardous due to the degree of "earth body" disturbance. This is not time for complacency and ignorance. Please refer to my latest blog ( March 2011) on Japan.
To read the full Space & Science Research Corp Press Release explaining the cycle of natural events they expect to unfold in these coming times
Update 18 March: News you won't hear on NZ television: Russian physicists present a warning of major quakes in fortnight to March 26
Update 19 March 2011: NZ scientists without any fanfare have begun to search the seafloor for fault lines offshore in Pegasus Bay which could be implicated in further quakes impacting Christchurch. Read the NEWS release.
This information is very relevant as this exploration is likely based on a strong potential for the seafloor to be the next source of a significant quake & tsunami.
This adds to prior information I have received indicating the same potential in exactly the same survey area.
As if Christchurch hasn't had enough, the indicators are raising the risk factors in this region. The aftershock pattern looks to be travelling west to east, with more events on the seafloor.
Update March 21
The following graphic shows the aftershock pattern of the past week in Christchurch with the highest magnitude of the day graphed. March 20 did show more and stronger seismicity in Christchurch as well as in other NZ locations, particularly 3 events over M4 in Twizel and a deep M5 off Tauranga. The data exists on Geonet for anyone to follow - or on the Quakemap site

Graphic supplied by Waiheke News
Update March 23 2011
The aftershock pattern has up till 2.39 pm subsided on 21, 22 March in Christchurch but this by no means indicates a stable situation because of regional conditions. Complex factors coincide to cause major quakes and finding a 100% totally reliable trigger indicator continues to elude researchers. For this reason many people will suffer the sudden shock of no warning before a quake emergency. Few scientists are prepared to provide even long-term graphic warnings but this one did appear in the NZ Herald 2006 regarding the Alpine Fault.
And prior to this, an academic paper in 2000 by geologists in respect of the 1994 Arthur's Pass quake (M6.7) concluded:
The occurrence of this earthquake sequence implies that the level of seismic hazard in the central South Island is greater than previous estimates.
So why are people who live in seismicly hazardous regions kept in the dark and this knowledge only receiving limited distribution?
A blog covering overseas weather & quake forecasters who believe prediction is possible
Update March 31
The pattern identified by Ken Ring did hold on March 20 - but he over-estimated the intensity of the aftershock - it was 5.1 not M7 or higher. The reason I think he got it wrong is because of far more factors being overlooked - this is explained in my theory posted March 26
Note too that the peak of the supermoon, March 20 in NZ, coincided with the only Mag5+ (5.1) aftershock since February 22. ( On Feb 22 3 M5+ aftershocks occurred). It is now March 31 and March 20 still holds the record for highest magnitude aftershock. Strangely though, this data is not entered (yet) on Geonet's listing of highest aftershocks
Update April 13 2011 Please view more recent quake related posts, including more on the prediction issue; and the Christchurch Quake Map is said by them to have the better updates compared to Geonet
Update April 14
With a recent largely downwards trend in Christchurch aftershocks, the situation may appear to many residents to be resolved. It is evident that geoscientists in NZ are unable to guarantee this and the potential for further damage remains real. Of immediate concern is the amount of disturbance and disharmony created due to the frustration of being a local trying to live, work or just survive in dramatically altered circumstances. The stress of each individual becomes part of the fabric of fractured Christchurch. Under these conditions it will take a considerable amount of time for harmony, flow, optimism and a sense of security to overcome the opposite state of affairs. Factoring the human layer of discord, on top of the fractured earth means some people will see their future being somewhere, anywhere else. To stay in Christchurch in the meantime, means doing the hard yards with no guarantees that rebuilding is a wise decision for the city.
Update April 16
Sad stories of extreme stress are coming out of Christchurch, the latest, in which a woman is charged with attempting to murder her children by carbon monoxide poisoning ( this usually involves car exhaust emissions) , it appears she and the children were taken to hospital and all have recovered.
5.49 pm tonight a M5.3 struck in the seafloor, near Camp Bay, Diamond Harbour, causing further damage. Solar-lunar factors are currently high, along with perigee moon and full moon Monday.
An uptick in global quake activity over M5.0 has been observed in recent days - USGS data
Update May 4 2011
Christchurch has generally seen a quiet period in terms of recent seismic events since the M5.3 noted above.
In contrast, the human instability appears to be widespread and growing: an uptick in smoking( less people giving up), drinking and pokie machine use ( Red Cross Grants squandered) A summary in this recent blog and more in this article, plus a surge in night-time burglaries , show the degree of stress in the communities of Christchurch. A surge has been recorded re Christchurch locals leaving for Australia
The overall picture contributes to the sense of a place beset by struggling, difficulty, despair and generalised stress. These consequences are typical following a major traumatic event within a person's personal life. The Christchurch situation is many times bigger than the personal, it is collective and communal. Those with the ability to leave are still advised to seek a better situation elsewhere for their recovery from the events they have been exposed to in Christchurch-Canterbury.
Though the aftershocks are currently of low magnitude, the continual subterranean instability caused by dozens of events per week, is not a good sign.
Update May 26 2011
Christchurch has had more than its fair share of fires in recent weeks - the latest. Fires whether spontaneous due to wiring faults or whether deliberately lit, add to the stress upon people, due to the out of control capacity of fire to echo the natural destructiveness of geophysical and extreme weather events.
Despite all the indicators of forces working against there being an easy ride in Christchurch many are choosing to make the best of their situation, with great optimism. Good on them. That is their destiny.
Recent quake data shows fewer and weaker magnitude aftershocks overall - offset by out of the blue single larger events over M4.0.
Update June 13 2011 The third most significant sequence began on this date in the eastern Richmond Hill area, M6.4 being the highest in this sequence . This marked the significant clustering of aftershocks in the south eastern and coastal part of the region
Update Sept 6 2011
With the anniversary of the Sept 4 2010 M7.1 quake having passed this week a lot of analysis has gone on, since many people's lives are still severely disrupted. This article covers a lot of the science information re the events to date and the future outlook, since no one can provide a guarantee of the situation coming to a speedy end.
Author's comment updated February 2016:
This post has become the largest archive on this blog site of the Christchurch quake sequences.
Other later posts Recent Quake Data, Christchurch Shakes Again & Again, Quake Warnings Extended have less updates and do duplicate a lot of material.
The enduring situation in Christchurch has suggested that the original concerns related to Christchurch's viability remain very much alive even after 5 years
From here latest updates are posted at the top
under the introduction


Hi I read your site with interest and a lot of it makes sense. I think you are very talented.
ReplyDeleteHowever I am a chch resident and a mother to many children - not all of them mine biologically. Our family is not your run of the mill family and getting consensus between all parties to agree to leave is not really going to happen - this means that at least for the next few years we will remain in chch. Your dire warnings about chch are hard to hear for those who have to stay.
thanks
Thankyou koru for your comment. I sympathise with your predicament and in your circumstances it clearly is very hard to face such uncertainty. Since local scientists are at the very least advising of long term seismic activity in the region your family will need well planned coping mechanisms regarding stress levels as well as practical plans for potential periods with no amenities. Enduring long term adverse personal, local and regional conditions is far from ideal for anyone, but that is currently the reality now for many trying to live and work in parts of Christchurch, even if nothing more damaging occurs. Knowing how much stamina you and your family have is the bottom line. When enough is enough even the tough may concede that nature is the more powerful.
ReplyDeleteThanks for your reply
ReplyDeleteToday the sky is blue and the sun is shining and there is so much postive energy to feel, it is amazing to me how resilient and just fine most people are. Yes the bigger quakes are horrible and I really hope we are not going to experience something worse. But really where would we go that is guaranteed safe. The world is not safe. Things happen. We could pack up and move only to find that the quakes follow us. I came here for safety reasons, it is wonderfully ironic to me that the place I chose ended up to be so unsafe - a lesson here perhaps. No more running in fear for me anyhow. Thanks for your work :)
I hope you and your family remain in a good space in every way
ReplyDelete