 |
| US Drought Monitor 2020-2023: A snapshot inserted here January 2024 |
Update April 2020
Looking at Drought in the 2020s
Since the original post was compiled in 2011 evidence continues to affirm the author's observations that particular positions of the outer planets are signposts of drought - the ancients used direct observation - the modern observer has historical records and search engines -and the ability to match these with predictions using the methodology outlined is clear. Data is data
The advantage of knowing planetary movements in advance using an Ephemeris enables advance warning far beyond the time frames of standard meteorology.
What is clear when viewing the 2020s is that - as usual - there are preceding conditions that feed into the present era.
With current references to "megadrought" conditions it is timely to look ahead. By now conditions in your local landscape will confirm where you are placed on the spectrum of severity regarding what is to come
The buildup of outer solar system planets in the dryness indicator Capricorn since 2008 has seen firstly Pluto & briefly Jupiter then Saturn [from 2018], next a return of Jupiter late in 2019 all combining in that primary drought signifier Capricorn.
Prior research has shown that outer planets in any one or more the Cardinal sign group: Aries Libra Cancer Capricorn feature consistently in drought periods. [these 4 signs are our seasonal markers and identify the Tropics and their lateral angles]
Outer planets Jupiter Saturn Uranus Neptune and Pluto in these signs are the significant carriers of the energy in these signs - modern era events in the periods 1970-1974 India & West Africa; late 1980's North America, UK & Europe; 1990's China Australia New Zealand - are some of the examples displaying this pattern.
The other main sign indicator is Pisces [water] which can be excessive/extreme when carried by a transit of Neptune -but the extreme can go from deluge to drought if Neptune is harnessed by a planet in a restraining state or sign - and when a restraining planetary energy - especially Saturn - is in Pisces.
Cardinal sign Aries is second in line after Capricorn in meteorological terms. Aries is heat so if a major planet is in Aries and one or more in Capricorn [1990's] then the effect is strong.
Overall all 4 Cardinal signs play a role in creating balance and imbalance
Looking at a timeline projection:
- 2020 Jupiter Saturn [partly] Pluto in Capricorn
- 2020 Neptune in Pisces
- 2021 Pluto in Capricorn Neptune in Pisces
- 2022 Pluto in Capricorn Neptune in Pisces
- 2023 Jupiter in Aries Saturn in Pisces
- 2023 Neptune in Pisces Pluto in Capricorn
- 2024 Saturn in Pisces Neptune in Pisces
- 2024 Pluto in Capricorn
- 2025 Saturn in Pisces Neptune in Aries
- 2026 Saturn in Aries Neptune in Aries
- 2027 Saturn in Aries Neptune in Aries
- 2028 Neptune in Aries until start of 2039
Neptune in Aries heats water/the seas/the oceans.
Check the variable states of Mars during the period from 2025-39 as Mars in Aries will aggravate the heat - as will other fire signs Leo and Sagittarius. Mars in Pisces and Cancer will be less intense. Scorpio is water but is a destructive mode. Mars in earth signs especially Taurus and Capricorn heats the Earth.
Pluto's long reign 2008-24 has not occurred in Capricorn since 1762-1778 so observations are much more limited for the longest cycle planet [which happens to be small but powerful]
Outer planets in Taurus show impacts upon the Earth itself and soil.
In 2020 planet Uranus is part way through its 7 year stint in Taurus [last cycle in Taurus was WW2 era mid 1930's-early 1940s when the earth was shaken by bombs and warfare] Uranus is a sudden shock unusual change unexpected event type of energy. Uranus was in the heat sign Aries before entering the physical form sign Taurus in 2018. The cycle of Uranus is approximately 7 years per sign for a full cycle of 84 years.
2018-2026 is when Uranus in Taurus changes the nature of physical forms especially the Earth itself and the soil and everything derived from the land -even before such changes are visible.
All combined it is clear that a very long complex event is underway starting in 2008 and significant until at least 2030 when Saturn leaves Taurus, leaving just Neptune still in hot water mode. Saturn in Taurus is a rebuilding energy which may restore some of the aftermath effects on the soil of Saturn in Aries.
Drought is clearly a natural and recurrent event on this planet -with variable intensity as highlighted using this method. The past is full of lessons learnt. May those be well used in this decade
Prior records and research follow with the original post at the end of the updates section.
Planetary cycles are indicating
In 2011, US drought indicators resembled the early stages
of the Dust Bowl which rocked the USA in the 1930's.
This blog tracks developments from then using analysis and forecasts based on planetary cycles.
Conclusions are reached which line up with those
from diverse perspectives including historic records
 |
| July 19 2011 drought map from US Drought Monitor |
Watching the massive Arizona dust storm of early July 2011 brings to mind the Dust Bowl era, which dominated the American natural environment and economy in the 1930's
A 2010 environmental report cites relevant climate events involved.
This post looks at various examples, including the USA & other global situations noticing significant drought events.
For those who wish to read about the role of solar system planetary cycles in altering Earth's climate, the detailed analysis in the original post below identifies which factors are repeating in this era up to 2016.
Please refer first to latest updates -or scroll down to read the original 2011 report
Latest updates:
2018
May 2018 US drought monitor -source

As anticipated by the forecasting method used in the original 2011 report:
This trend continued as shown by the early March 2017 drought map for the US

2016
 |
| US Drought Monitor |
Western drought abated in August while flood arises further east -typifying prevailing drought/deluge conditions as forecast in full report below the following updates:
February
Extreme and exceptional drought conditions continue in California -despite near record snow
As stated in 2011 the planetary pattern regarding drought in 2016 was identified:
"Saturn in mutable Sagittarius will square Neptune in mutable Pisces from December 2015-October 2016 - a significant drought indicator" which has potential for multiple global contexts.
Full detail in main report

2015
November -record El Nino -exceptional drought in California also spells scenarios of funneled flooding
September 2015
 |
| US Drought Monitor California segment Sept 17 issue |
The Washington Post reports on the 4 year California drought -saying it is the driest in 500 years
While wildfires rage in the north, a mid september deluge in the Los Angeles region proved how parched earth simply funnels most of the hydrating fluid across surfaces rather then down. A chaotic outcome affecting all types of infrastructure.
This season added around a thousand more wildfires in California than the tally for the last season
Sept 15 full US drought monitor map confirms yet again the Western states in trouble

Compare drought geography Sept & Aug 2015 with 2011 on the right

August 18 2015
US Drought Monitor map issued August 18

August 13 2015
Extract re the environmental effects of Saturn on our terrestrial conditions from the special report
Conditions related to the creation of floods and droughts will be a significant factor at certain points: late November early Dec 2015, May, June, July, August, September 2016. Hemisphere differences and localised patterns will be the clue as to whether it is more likely to be an excess or deficit of water"The periods noted in 2015-2016 reflect when the water element is either destroyed or becomes destructive. This equates to loss of water or too much water - both are environmental negatives.
[Saturn is at 90 degrees to Neptune an angular dynamic that offsets earth structure against water. ]
August 1 2015
El Nino is forecast to return strongly.
El Nino conditions in 2015 are already pointing to heat and drought with Northern China low on drinking water
El Nino events related to this comparative study, occurred in the periods 1925-1926, 1930-31, 1932-1933, 1939-1940, 1940-1941, 1941-1942.The strongest event in recent decades was the 1997-98 El Nino.
Weak El Ninos occurred 2004-2007, Moderate in 2009-10.
The return of El Nino for 2015-2016 is potentially strong to very strong & if a run of El Nino years occurs as in 1930-1933 or 1939-1942 then the flow on economic effect will also be sustained.
April 11
Video and graphics explain implications of California extreme drought for US economy
April 4
The latest drought monitor map for the US is clear in emphasising the state of California

Scroll down to compare this to April 2014
This NY Times news article is very clear in identifying the path ahead
Relevant universal influences affecting Earth.
This section summarises the analysis of cyclic universal factors, in the form of planetary pairings and positions which according to historic events, repeatedly feature in environmental consequences on Earth
Developments to note include the return of Saturn to Sagittarius = a signature of stunted growth, deformity which translates at the fundamental level to crop failure.
Saturn remains in Sagittarius for the most part - Xmas 2014 to Dec 21 2017 - 3 years, aside from a brief retrograde into Scorpio .
The drought-deluge potentials are emphasised in the last week of Nov 2015 and through the first week of Dec 2015.
This is when Saturn and Neptune both hover around 7 degrees -offset at 90 degrees to each other.
Places prone to drought will most likely get intensification then.
Places prone to deluge will most likely get destructive water that also destroys growth. Drought also causes water funnelling, floods.
Note also that snow is water.
Snow can provide destructive effects on growth and damage in the melt phase. This is also a Saturn-Neptune combo
Full details in the original post
-scroll down
2014 updates
July 12
Multiple influences affecting jetstream creating locked in patterns: drought versus deluge. You will know by now what prevails in your local environment.
The influences are intensifying through July and into August 2014
July 2
 |
| ..once a reservoir San Jose [Getty] |
2014 -May
The West Without Water a text by Ingram & Malamud-Roam
"The West Without Water documents the tumultuous climate of the American west over twenty millennia, with tales of past droughts and deluges and predictions about the impacts of future climate change on water resources." read more
Some data via tornadotitans.com

Long range forecaster Cliff Harris has some very interesting articles on the Long Range Weather site.
This historical global trend graphic is worth a look

Cliff Harris reports that the Weather Science Foundation identified 4 historical cycles -cold-dry, cold-wet, warm-wet, warm-dry.
2014 remains in the warm-wet, heading for warm-dry.
The 1930's was a warm-dry and the cycle of around 100 years is expected by their calculations to resume around the 2030's
Exceptionally strong weather extremes including the winter snows are also noted by Cliff Harris.
End of April 2014:Exceptional drought zones have enlarged

2014 - February:
Very clear now that the drought conditions have moved West of California


January 30 2014
Off Twitter:

January 26
Megadrought in California? -article
January 6
Drought issues in California as evident in the latest drought monitor map
 |
| source |
2013 updates:
September 5

August 28
The connection between drought and wildfires - brief video
The Yosemite wildfires remain largely uncontained - report
NOAA drought monitor August:

August 8
In early August 2013, aside from Arkansas, flash flooding has hit states largely to the east of the major drought zone.
Imbalance, too much, too little remains the theme.
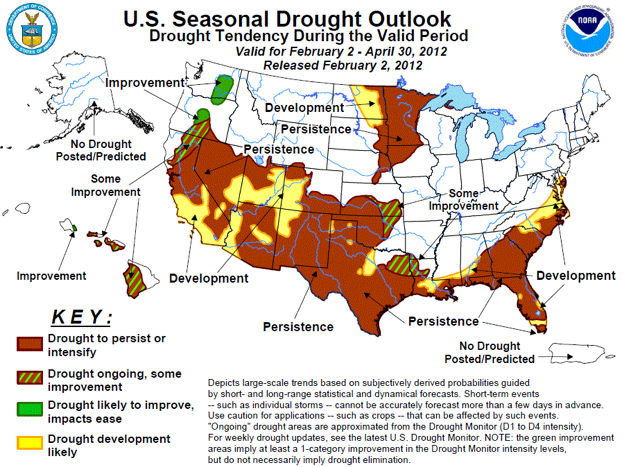
Most of western US expected to remain in persistent drought.
US Drought forecast - view full PDF or click to enlarge graphic in new window

June
A record setting heat wave in the US, exceeding 128F in places.
End of June, New York Times report on the intensifying conditions in the West
Out of control wildfire in Arizona -report
June 25 drought map for the US

April 2013
April 13 saw another locked in drought indicator:
In environmental terms:
Uranus in Aries is warm wind. Saturn in Scorpio is transformed land - which is likely to dry out and add to drought issues in vulnerable areas - particularly as the pattern ranges over the next 6 months -being exact again in early October 2013 [Saturn 10.27 Scorpio, Uranus 10.27 Aries on October 5]
US Drought Monitor -April

Research:
...this cycle [current sunspot Cycle 24 ] should be like Sunspot Cycle No 14, and be followed by two that will create a brief ice age. During the 1920s and ‘30s Australia’s Bureau of Meteorology published research about the sun/climate relationship, especially Sunspot Cycle No 14, showing that it probably caused the worst drought then on record.
The sun ejects enormous quantities of matter continuously in the form of the solar wind, or periodically as either a mix of high energy protons and electrons (Coronal Mass Ejections, (CMEs)), or as mostly high energy protons (Solar Proton Events (SPEs)). The earth’s atmosphere is more sensitive, and more reactive, to the CMEs and SPEs than to the sun’s short wavelength radiation, to
which it is, in any case, highly reactive. The effect of the solar wind, CMEs and SPEs is to reduce the amount of ozone and as a result, warm the middle atmosphere. The overall effect on climate
is more turbulence: stronger winds, more storms and greater precipitation....the entire field of planetary-lunar-solar dynamics, including gravitational dynamics, has to be studied so the dynamics of terrestrial climate can be understood - source
 |
| little rain in 3 months over much of New Zealand to April 2013 |
March12 2013
The United States drought of 2012 was unprecedented in many states and depleted water resources through the year. Drought conditions are still rated as "exceptional" right across the midwest, from Texas to the Great Lakes, nearly a year later. - Dr James Renwick is Associate Professor of Physical Geography at the School of Geography, Environment and Earth Sciences, Victoria University of Wellington, New Zealand.Wikipedia reference on current North American drought has some background info.
From New Zealand: a Greenpeace perspective on the drought's impact on NZ agriculture - report
From Australia: ..."the agricultural sector is now brushing close to Great Depression conditions" read this report regarding debt & crop loss in the Wheat Belt of Western Australia - report
March 10 2013 The UK Met Service calls for urgent action to prepare for extreme weather events
noting that "droughts and floods will be common events in Britain'. - report
New Zealand now reports the worst drought in almost 70 years, officially declared now for most of the North Island -but soon to cover parts of the South Island.
It seems the extremes are what the world now faces, rather than a simplistic warming scenario
Refer to my April 2012 post on the period 2010-2016 : water issues -too little-too much and 2015 Heat Flood Drought Fire
 |
| NZ graphic from NIWA |
March 4 2013 New Zealand - after a baking hot summer, begins to declare official drought, starting from the north of the North Island (latitude 34.35-36.48 South) & soon to include other North Island regions - report report2 & NZ climate maps
US: As a comparison refer to this Dec 2012 drought map compared to January & February 2013


2012 updates
June 2012
The latest USA drought map courtesy of NOAA - click to enlarge all graphics

Colorado wildfires
Tens of thousands evacuated in June 2012 as the worst fires in the state's history rage - report
US Heatwave -more than a thousand heat records broken in a week, late June 2012 - report
Both North & South Korea experiencing 'worst in a century" drought - report
2012 mid April
Drought expands throughout USA. Hasn't been this dry in 5 years -full report
Abnormally dry areas recorded north, south, east and west - see Drought Monitor map
April 5 2012
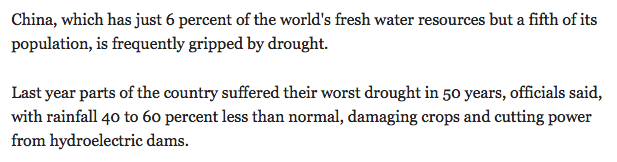
Meanwhile, China has entered a drought sequence
Scientific American reports:

April 2 2012
Accuweather provides a summary of the warmest March ever in multiple US cities and states
March 22 2012
Economic impact report on the current US Texas & southwest drought - with more heat predicted
Feb 20 2012 Issues outside of the US:
Feb 3 2012
This post has proved very popular so updates will be maintained as necessary.
 |
| click all graphics to enlarge |
 |
| CLICK TO ENLARGE or VISIT SOURCE SITE |
Worst drought in Texas history causes farm stock reduction
China's largest freshwater lake -parched dry - see photos Lake Poyang
2011 updates
Drought zones USA July 2011 - Dust Bowl again in strife
Click link above to view large map of the environmental hazards currently in USA - source: NOAA [update October 2011] news item linking backing to Dust Bowl era


Update July 12
A NOAA map has been inserted in the main body to show current drought in the Dust Bowl and a comparative map of the Dust Bowl region.
Update July 13
Astrologer Alice Portman shares her research on flood cycles linked to eclipse triggers
Check out this astro-meteorology specialist who confirms the view ahead. Theodore White says:
climate events - such as flood and drought - can and do exist together and occur very close to one another, or even at the same time under particular planetary configurations, which I remind everyone are cyclical.
Update July 14
An American climatologist underestimates the indicators of long-term Dust Bowl drought
Update August 17 2011
Here's some climate maps and commentary re July 2011 in the US -showing extremes
Update August 26
There is ongoing interest from online searches in this post so want to add an excellent global map from NOAA showing how extreme the central US drought zone is. (may be slow to download)
Update Sept 9 2011
This US NOAA report is worth reading re Texas drought conditions From Nov 30 2011 New York Times -secrets of the deep revealed as drought causes lakes to recede
- article
-------------------------------------------------------------------------------------------- |
Dust Bowl Drought - the return of cycles
Original Post From July 2011 onwards, begins here, featuring indepth identification of planetary indicators impacting Earth's environment
A 2010 environmental report cites relevant climate events involved
Anyone with a long memory, or the ability or inclination to research cycles can see how history repeats, often too in the same place, since every place, person and thing has an inherent vibrational resonance - and like a tuning fork, will respond when a matching vibration arises from the larger, universal environment.
So if we look at the period 1931-1939 inclusive, people from different disciplines will uses their frame of reference to identify what was happening then, to create particular consequences. Farming methods were blamed but nature itself was in control. Climatologists will use the terms jet stream and southern oscillation, amongst others, now, looking back with hindsight.
We are witnessing in 2011 the early stages of events which rocked the 1930's USA.
This conclusion can also be reached from diverse perspectives.
Here is the analysis based on planetary cycles:
The cycles of the planets, are detailed fully for the present, past and future in an ephemeris, compiled using software, using known patterns of movement over time. The mathematics alone show how points in time are connected when a planet is positioned at the same or an angularly related position. ( positions within say 3 degrees of exact, along with 45 degree, 90 (square), 135 and 180 (opposition) degrees are particularly important - and found to feature when the energy of two or more planets merge in time with an observable outward event.
The outer planets and Moon's Nodes emphasis on Cardinal signs in 1931 is strong, with positions in Cancer Capricorn, Aries and Libra all involved in strong planetary dynamics.
These four signs are the seasonal markers as well as marking the equatorial north and south passage points ( Aries-Libra) and the Tropics of Cancer and Capricorn - these all cover the territory where the sun, moon and planetary belt interacts with Earth.
These powerful astronomical factors of how earth is impacted by other bodies in space, means I believe, that these 4 cardinal signs have significant environmental impact when the power group Pluto, Uranus and Saturn in particular pass through those sectors.
1931
1. Pluto in Cancer opposite Saturn in Capricorn
2. Pluto and Saturn both square the moon's nodal positions in Aries-Libra
3. Uranus in Aries squares both Pluto and Saturn
1932, 1933, 1934
Uranus in Aries square Pluto in Cancer
(in terms of elements: hot wind vs deep changes in lunar, tidal, fluid levels)
1934
Saturn, the planet corresponding with restriction, dryness and drought ( see extended keywords ref.) is in the sign related to wind [Aquarius] and this intensifies the destructive effects of Pluto and Uranus.- as tight alignments occur in this year
After the emphasis on cardinal signs in the early 1930's, the focus then moved to mutable signs
(Pisces, Virgo, Gemini, Sagittarius)
1935
Saturn enters the water sign Pisces and interacts with the energies of Jupiter and Uranus
Pluto the transformer makes a hard [destructive] contact with Neptune, the planetary signifier of water,
Pluto is in exact contact with the Moon's nodal position, emphasising destructive effects from changes in lunar, tidal, fluid levels and earth-planet/soil structural aspects
Uranus is exactly square to the moon's nodes = the effects of hot wind on the above aspects
1936
Saturn gains dominance over drought conditions, being both in the water sign Pisces and opposite Neptune. Any planetary opposition generates issues re a need for balance
1937
The year begins with Saturn still in Pisces, opposing Uranus in earthy systems sign Virgo
Jupiter in Capricorn (abundant dryness, restricted growth) opposes Pluto in Cancer (deep changes in lunar, tidal, fluid levels)
1938
The prevailing energies already set in motion, keep their momentum during this year
1939
The year begins with abundant (Jupiter) water (Pisces) energy
In March, when Jupiter in Pisces opposes Neptune in Virgo , the energy is set in place for the drought-breaking rains to arrive in the next fall.
Those are the standout factors for this comparison ( though not a full analysis of all contributing planetary elements) because when the current and upcoming period is examined, repeating aspects are evident.
Drought In the 21st Century -a Summary:
The cycle repeats
From July 2010 Saturn's drying and blocking influence has held sway in the cardinal sign Libra, relating to issues of balance/imbalance.
Saturn remains in Libra until October 6 2012, after which the sign of Scorpio follows for almost 3 years.
The effects of Saturn now bring endings, transformation and new beginnings, commonly marked by the symbolism and actuality of death - re Saturn's domain of the surface crust & soil.
2. 2011 sees the start of a long-term 90 degree square-off involving Pluto in Capricorn and Uranus in Aries (2011-2016). This is a signature of environmental extremes (in terms of elements: hot wind vs deep changes in lunar, tidal, atmospheric & fluid levels; earth element [ soil & ground ] undergoing restructuring; imbalances exposed)
3. In 2013 early April and early October are two markers with Saturn in Scorpio offset against Uranus in Aries: transformation of the soil element in conjunction with hot winds; death and transformation from dryness. This pattern reinforces the already strong drought indicators in play
4. Saturn-Uranus Neptune-Nodes July 2014 - drought and imbalance indicators
5. Saturn in mutable Sagittarius will square Neptune in mutable Pisces from December 2015-October 2016 - a significant drought indicator
Essentially, the Pluto-Uranus cycle is being witnessed again as in the 1930's, USA, and the effects of Saturn (restriction) on water are repeated.
This post is primarily about environmental matters, but a further reinforcement of repeated cycles comes in this commentary on 1930's financial issues in America:
During that month of June, 1931, there was a foretaste--and a sour one--of many a financial scandal to come, when three officers of the Bank of United States were convicted by a jury in New York, after shocking disclosures of the mismanagement of the bank's funds during the speculative saturnalia of 1928 and 1929 - source
Whether the drought conditions target America again is an interesting question, but the issue is, as stated initially, one of resonance - wherever on earth matches this particular combination of planetary conditions.
In 2011 it is the Horn of Africa as well as the USA responding to the Pluto Uranus factors.
The epicenter of the drought lies on the three-way border shared by Kenya, Ethiopia and Somalia, a nomadic region where families heavily depend on the health of their livestock. Uganda and Djibouti have also been hit. (HuffPost)
The Cardinal Crisis
Floods, Fires & Drought
This fascinating study of the period 1628-1643, during the Maunder Minimum ( extremely low sunspot period) provides a lot of mapped climate data from China during the Ming dynasty. Sustained planetary patterns were in process bearing the signatures of drought and flood -
- drought signatures in that time frame being typically Saturn square Neptune, Saturn square Jupiter, Saturn square Nodes & Saturn in Pisces.
- Flood signatures were Jupiter square Neptune, Jupiter square Nodes, Jupiter conjunct Neptune, Jupiter square Uranus
As expected, Pisces, mutable signs, Neptune figured continually in the flood signatures -but with Saturn in mutable SAG square the Nodes in mutable Pisces (1634) this would translate to a drought scenario, due to the over-riding effect of Saturn to restrict energies.
This ends the original 2011 post
Dust Bowl Drought, the Return of Cycles
addendum May 2018
It can be added at this point that the May 2018 entry of Uranus [unexpected or sudden change] into Taurus [earth, land, soil] will usher in further signs of change in the condition of the land & of the planet in general during the period up to 2026.
Due to the process of climate shift developing over many years the outcomes are sustained long-term with deluge and drought continuing as the hallmarks of nature in a state of severe imbalance -different locations will generally get the wet or the dry expected typical for their regional climate -but in a more extreme fashion.
Severe storms are also part of this picture.
Big changes will occur in agriculture, horticulture and land use in general. The value of land will be subject to sudden changes. [read more in-depth on the economic outlook in this era]
Also Read
Heat, Flood Drought Fire a 2015 update & summary


No comments:
Post a Comment